QUESTION IMAGE
Question
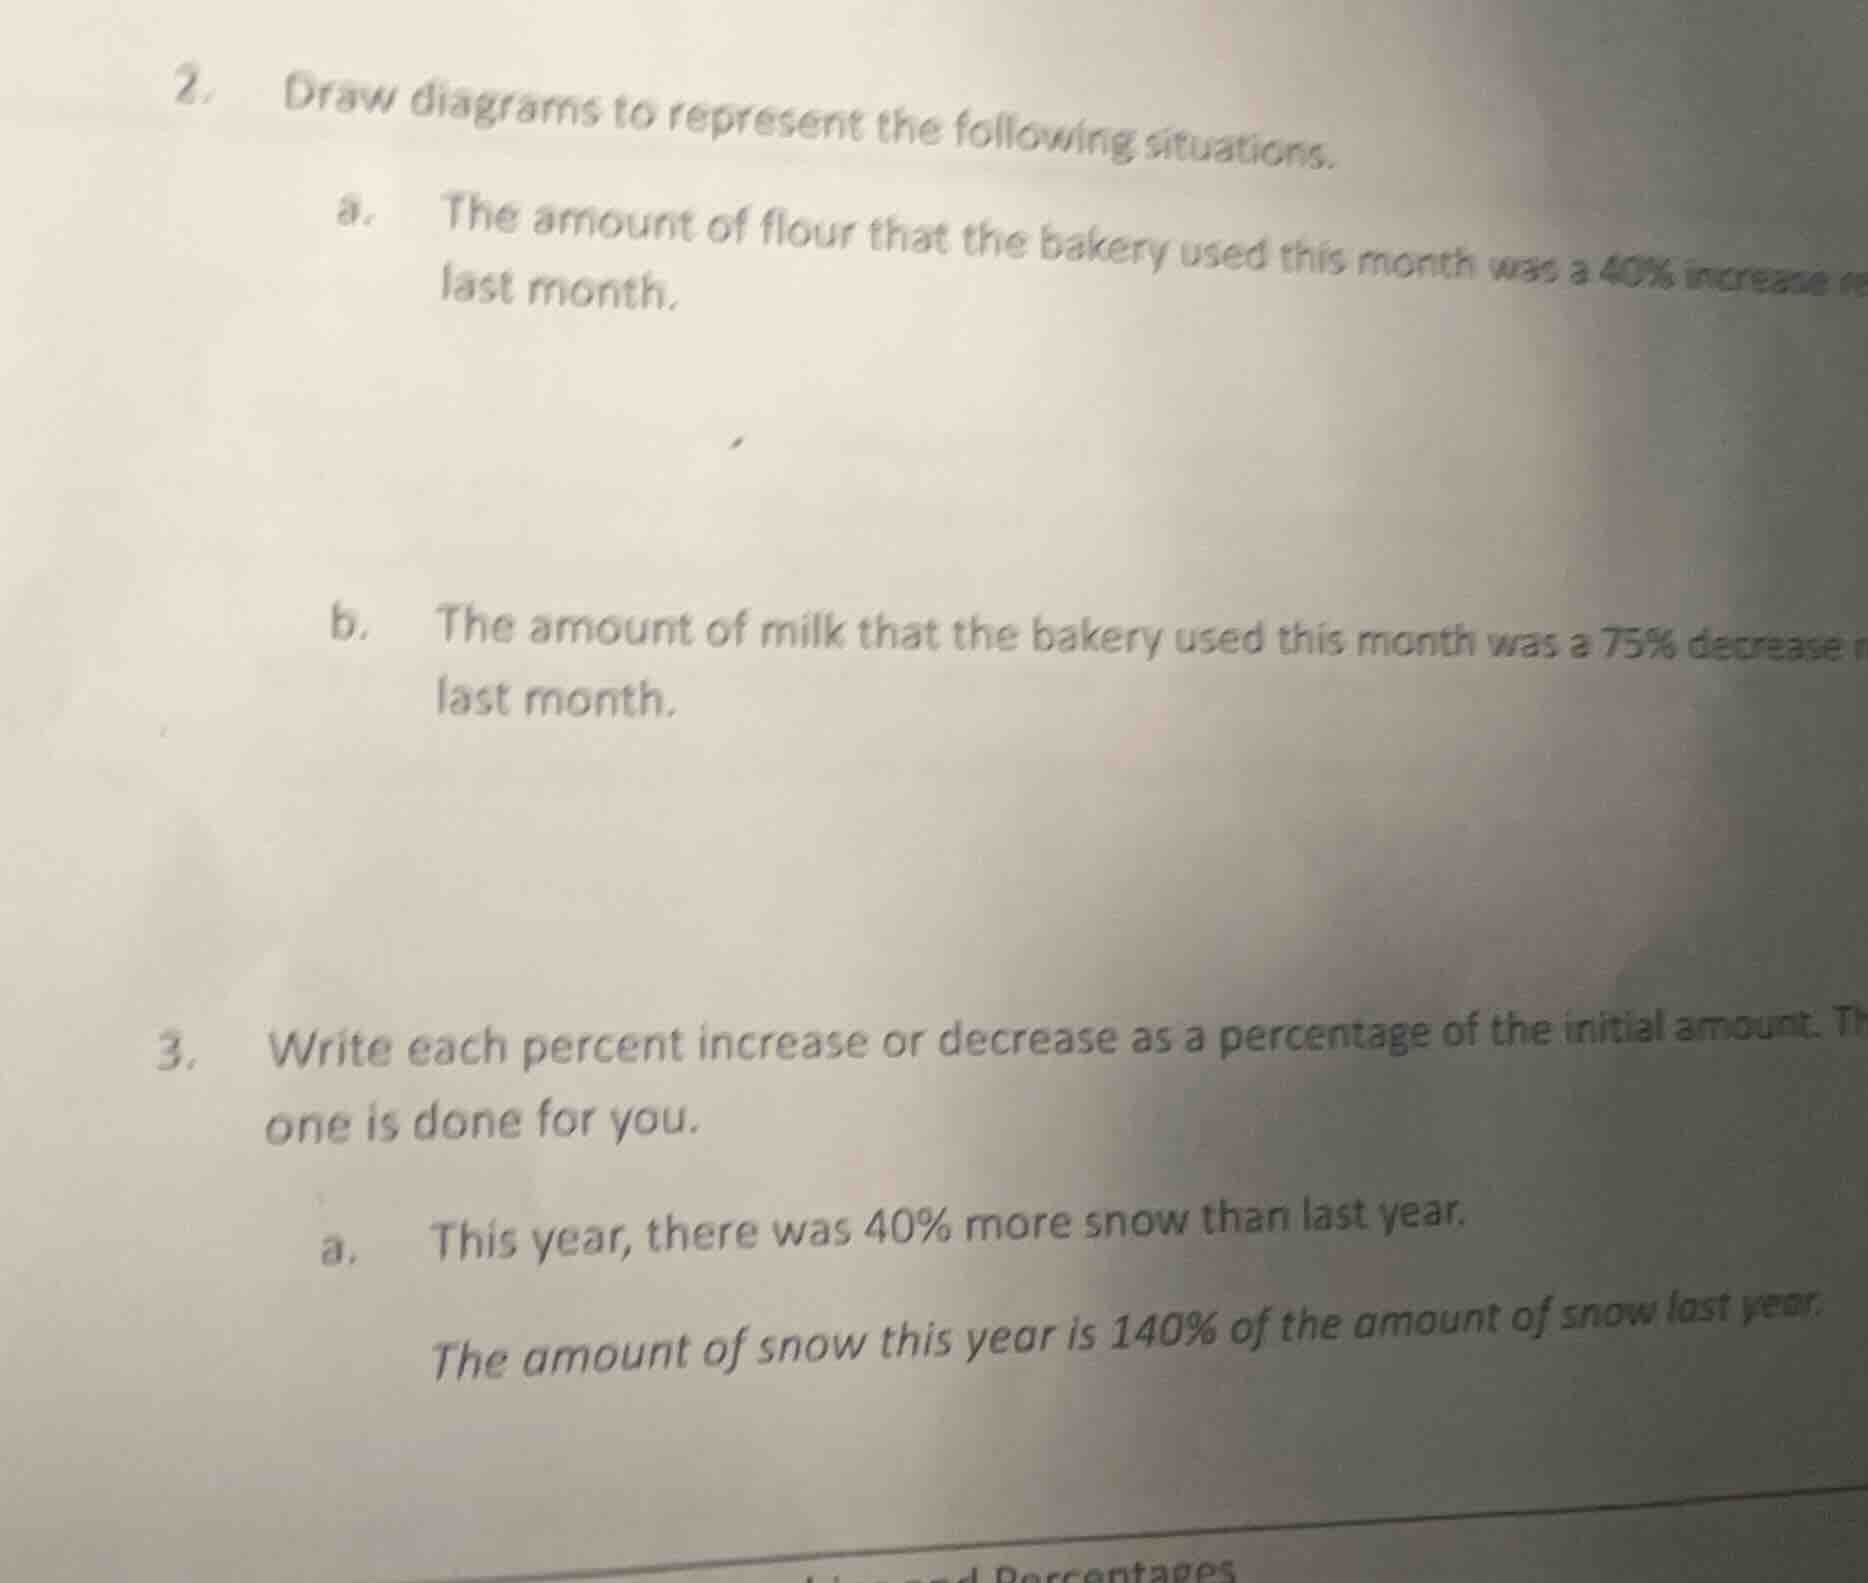
- draw diagrams to represent the following situations.
a. the amount of flour that the bakery used this month was a 40% increase last month.
b. the amount of milk that the bakery used this month was a 75% decrease last month.
- write each percent increase or decrease as a percentage of the initial amount. the one is done for you.
a. this year, there was 40% more snow than last year.
the amount of snow this year is 140% of the amount of snow last year.
Part 2a: Diagram for 40% Increase in Flour Usage
Step1: Define Last Month's Flour
Let last month's flour usage be 100% (represented by a bar of length, say, 10 units).
Step2: Calculate This Month's Flour
This month, it's a 40% increase, so this month's usage is \(100\% + 40\% = 140\%\) of last month's. If last month's bar is 10 units, this month's bar is \(10\times1.4 = 14\) units.
Step3: Draw the Diagram
- Draw a bar labeled "Last Month" with length 10 units (representing 100%).
- Draw a bar labeled "This Month" with length 14 units (representing 140%). Add an arrow or label indicating the 40% increase (the extra 4 units compared to last month's 10 units).
Part 2b: Diagram for 75% Decrease in Milk Usage
Step1: Define Last Month's Milk
Let last month's milk usage be 100% (represented by a bar of length, say, 10 units).
Step2: Calculate This Month's Milk
This month, it's a 75% decrease, so this month's usage is \(100\% - 75\% = 25\%\) of last month's. If last month's bar is 10 units, this month's bar is \(10\times0.25 = 2.5\) units.
Step3: Draw the Diagram
- Draw a bar labeled "Last Month" with length 10 units (representing 100%).
- Draw a bar labeled "This Month" with length 2.5 units (representing 25%). Add an arrow or label indicating the 75% decrease (the reduction of 7.5 units from last month's 10 units).
Part 3a (assuming there are more sub - parts, let's solve the given and a possible continuation)
Given 3a:
Step1: Understand the Increase
If there was 40% more snow this year than last year, we take last year's snow as 100%.
Step2: Calculate This Year's Percentage
This year's snow is \(100\%+ 40\%=140\%\) of last year's, which is already given as "The amount of snow this year is 140% of the amount of snow last year."
Let's assume a sub - part 3b: "This year, there was 30% less rain than last year."

Snap & solve any problem in the app
Get step-by-step solutions on Sovi AI
Photo-based solutions with guided steps
Explore more problems and detailed explanations
(for 3b):
The amount of rain this year is 70% of the amount of rain last year.
(Note: For the diagram parts, the actual drawing would be a visual representation as described in the steps. If you need a more precise graphical representation, you can use graph paper or a drawing tool to create the bars with the appropriate lengths and labels.)