QUESTION IMAGE
Question
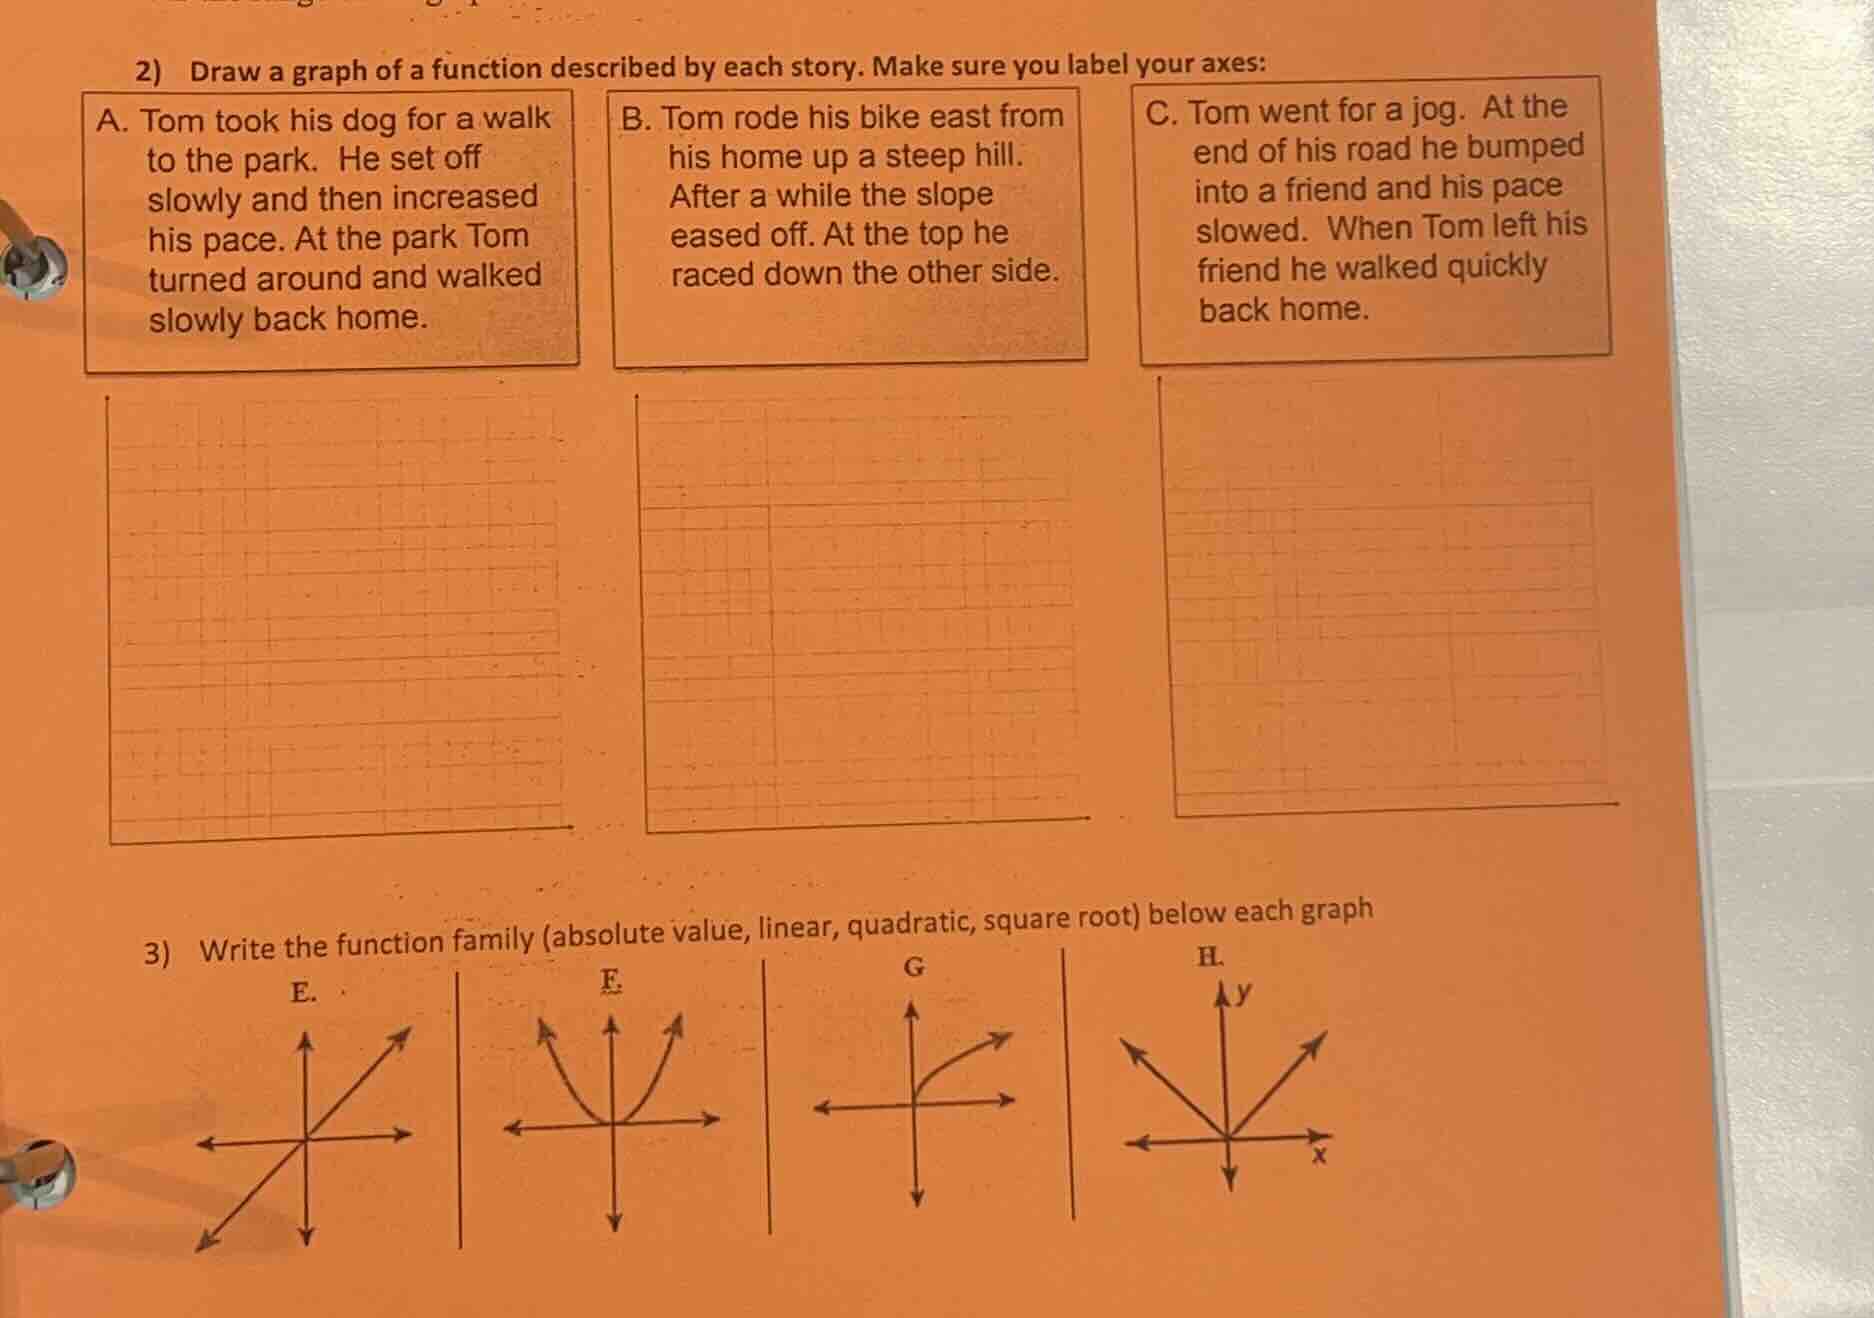
- draw a graph of a function described by each story. make sure you label your axes:
a. tom took his dog for a walk to the park. he set off slowly and then increased his pace. at the park tom turned around and walked slowly back home.
b. tom rode his bike east from his home up a steep hill. after a while the slope eased off. at the top he raced down the other side.
c. tom went for a jog. at the end of his road he bumped into a friend and his pace slowed. when tom left his friend he walked quickly back home.
- write the function family (absolute value, linear, quadratic, square root) below each graph
Part 2: Graphing the Functions (Example for Part A, B, C - Axes Labeling and Shape)
For Part A: Tom’s Walk
- Axes: Let the x - axis be "Time (minutes)" and the y - axis be "Distance from Home (meters)".
- First Segment (To Park):
- He starts slowly, so the graph has a small positive slope (shallow line) at the beginning. Then he increases his pace, so the slope becomes steeper (steeper positive line) until he reaches the park (maximum y - value).
- Second Segment (Back Home):
- He turns around and walks slowly back, so the graph has a negative slope (since distance from home is decreasing) and the slope is shallow (similar to the first slow segment) until he reaches home (y = 0).
For Part B: Tom’s Bike Ride
- Axes: Let the x - axis be "Time (minutes)" and the y - axis be "Elevation (meters)" (or "Distance East (meters)").
- First Segment (Up Steep Hill):
- The slope is steeply positive (steep line) as he goes up the steep hill.
- Second Segment (Slope Eases):
- The slope becomes less steep (still positive but shallower line) as the slope of the hill eases.
- Third Segment (Down the Other Side):
- The slope is steeply negative (steep line going down) as he races down the hill.
For Part C: Tom’s Jog
- Axes: Let the x - axis be "Time (minutes)" and the y - axis be "Distance from Home (meters)".
- First Segment (Jog, Then Slow):
- He starts jogging, so a positive slope. Then he bumps into a friend and slows, so the slope becomes shallower (still positive but less steep) until he stops (or has a constant distance while talking to the friend - a horizontal line).
- Second Segment (Back Home Quickly):
- He walks quickly back, so a negative slope with a steep (large magnitude) slope until he reaches home (y = 0).
Part 3: Identifying Function Families
Graph E (First Graph - Straight Line Through Origin)
- Explanation: A linear function has the form $y = mx + b$. When $b = 0$ and $m
eq0$, it is a line through the origin with a constant slope. The first graph is a straight line, so it is a linear function.
Graph F (Second Graph - Parabola Opening Up)
- Explanation: A quadratic function has the form $y = ax^{2}+bx + c$. When $a>0$, it opens upwards, and the graph is a parabola. The second graph is a parabola, so it is a quadratic function.
Graph G (Third Graph - Square Root - like Curve)
- Explanation: The square root function $y=\sqrt{x}$ (for $x\geq0$) has a curve that starts at the origin and increases slowly, curving to the right. The third graph matches this shape, so it is a square root function.
Graph H (Fourth Graph - V - Shaped)
- Explanation: The absolute value function $y = |x|$ has a V - shaped graph with a vertex at the origin. The fourth graph is V - shaped, so it is an absolute value function.
Final Answers for Part 3
- Graph E: Linear
- Graph F: Quadratic
- Graph G: Square Root
- Graph H: Absolute Value

Snap & solve any problem in the app
Get step-by-step solutions on Sovi AI
Photo-based solutions with guided steps
Explore more problems and detailed explanations
Part 2: Graphing the Functions (Example for Part A, B, C - Axes Labeling and Shape)
For Part A: Tom’s Walk
- Axes: Let the x - axis be "Time (minutes)" and the y - axis be "Distance from Home (meters)".
- First Segment (To Park):
- He starts slowly, so the graph has a small positive slope (shallow line) at the beginning. Then he increases his pace, so the slope becomes steeper (steeper positive line) until he reaches the park (maximum y - value).
- Second Segment (Back Home):
- He turns around and walks slowly back, so the graph has a negative slope (since distance from home is decreasing) and the slope is shallow (similar to the first slow segment) until he reaches home (y = 0).
For Part B: Tom’s Bike Ride
- Axes: Let the x - axis be "Time (minutes)" and the y - axis be "Elevation (meters)" (or "Distance East (meters)").
- First Segment (Up Steep Hill):
- The slope is steeply positive (steep line) as he goes up the steep hill.
- Second Segment (Slope Eases):
- The slope becomes less steep (still positive but shallower line) as the slope of the hill eases.
- Third Segment (Down the Other Side):
- The slope is steeply negative (steep line going down) as he races down the hill.
For Part C: Tom’s Jog
- Axes: Let the x - axis be "Time (minutes)" and the y - axis be "Distance from Home (meters)".
- First Segment (Jog, Then Slow):
- He starts jogging, so a positive slope. Then he bumps into a friend and slows, so the slope becomes shallower (still positive but less steep) until he stops (or has a constant distance while talking to the friend - a horizontal line).
- Second Segment (Back Home Quickly):
- He walks quickly back, so a negative slope with a steep (large magnitude) slope until he reaches home (y = 0).
Part 3: Identifying Function Families
Graph E (First Graph - Straight Line Through Origin)
- Explanation: A linear function has the form $y = mx + b$. When $b = 0$ and $m
eq0$, it is a line through the origin with a constant slope. The first graph is a straight line, so it is a linear function.
Graph F (Second Graph - Parabola Opening Up)
- Explanation: A quadratic function has the form $y = ax^{2}+bx + c$. When $a>0$, it opens upwards, and the graph is a parabola. The second graph is a parabola, so it is a quadratic function.
Graph G (Third Graph - Square Root - like Curve)
- Explanation: The square root function $y=\sqrt{x}$ (for $x\geq0$) has a curve that starts at the origin and increases slowly, curving to the right. The third graph matches this shape, so it is a square root function.
Graph H (Fourth Graph - V - Shaped)
- Explanation: The absolute value function $y = |x|$ has a V - shaped graph with a vertex at the origin. The fourth graph is V - shaped, so it is an absolute value function.
Final Answers for Part 3
- Graph E: Linear
- Graph F: Quadratic
- Graph G: Square Root
- Graph H: Absolute Value