QUESTION IMAGE
Question
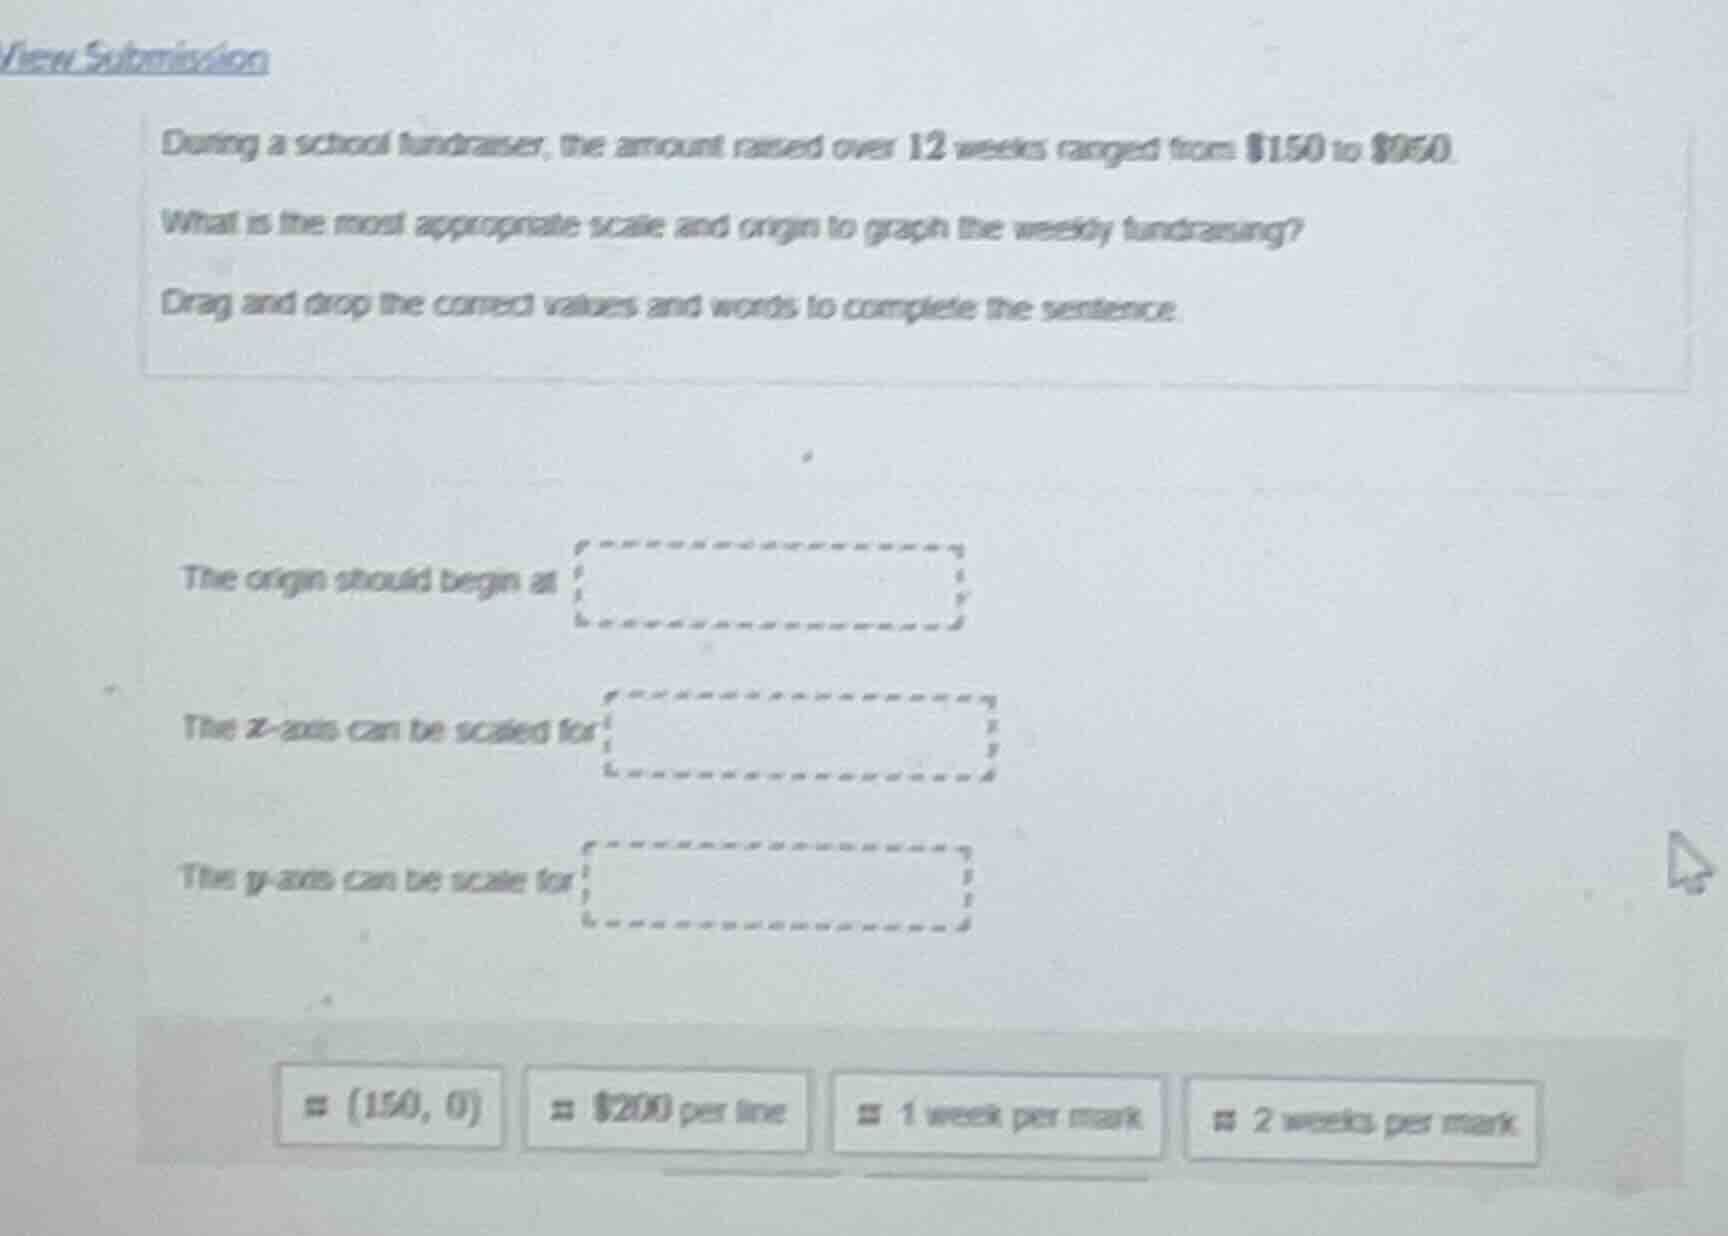
during a school fundraiser, the amount raised over 12 weeks ranged from $150 to $950. what is the most appropriate scale and origin to graph the weekly fundraising? drag and drop the correct values and words to complete the sentence. the origin should begin at the x - axis can be scaled for the y - axis can be scale for (150, 0) $200 per line 1 week per mark 2 weeks per mark
Step1: Analyze the origin
The amount raised ranges from $150 to $950, so the origin for the y - axis (amount) should start at the minimum value, which is $150. So the origin should begin at \((150,0)\).
Step2: Analyze the x - axis scale (weeks)
There are 12 weeks. To graph 12 weeks, a scale of 1 week per mark is appropriate as it will fit 12 marks (12 weeks) well. If we use 2 weeks per mark, we would need only 6 marks, but 1 week per mark gives a more detailed view of weekly data.
Step3: Analyze the y - axis scale (amount)
The amount ranges from $150 to $950. The difference is \(950 - 150=800\). A scale of $200 per line is appropriate. Let's check: \(150, 350, 550, 750, 950\) (starting from 150, adding 200 each time) covers the range from 150 to 950 (since \(150+4\times200 = 150 + 800=950\)).

Snap & solve any problem in the app
Get step-by-step solutions on Sovi AI
Photo-based solutions with guided steps
Explore more problems and detailed explanations
- The origin should begin at \((150, 0)\)
- The x - axis can be scaled for 1 week per mark
- The y - axis can be scaled for \$200 per line