QUESTION IMAGE
Question
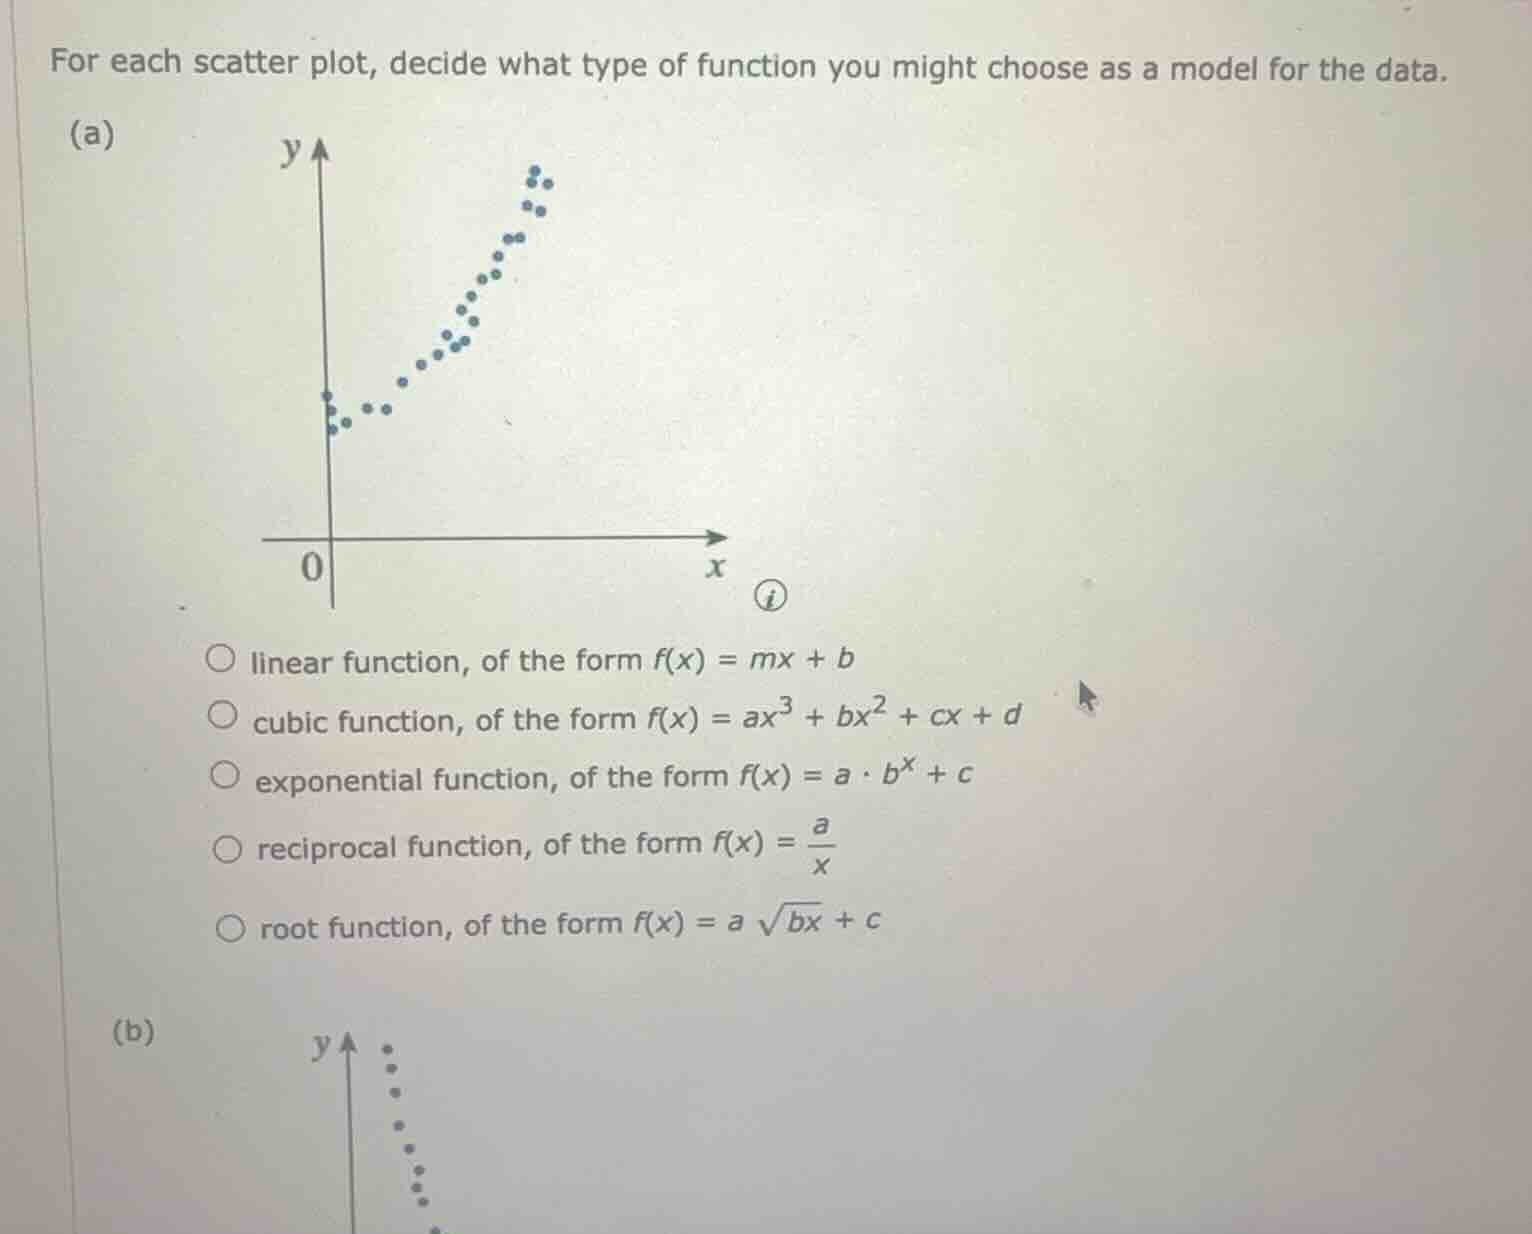
for each scatter plot, decide what type of function you might choose as a model for the data.
(a)
below the image:
linear function, of the form $f(x) = mx + b$
cubic function, of the form $f(x) = ax^3 + bx^2 + cx + d$
exponential function, of the form $f(x) = a \cdot b^x + c$
reciprocal function, of the form $f(x) = \frac{a}{x}$
root function, of the form $f(x) = a \sqrt{bx} + c$
(b)
For part (a): The scatter plot shows a curve that first has a slight downward trend then a steep upward increasing trend, which matches the shape of a cubic function (cubic functions can have local minima/maxima and increasing growth). Linear functions form straight lines, exponential functions show consistent percentage growth, reciprocal functions decrease toward axes, and root functions have slow, curving growth that does not match this plot's shape.
For part (b): The visible scatter plot shows a steep downward curve where y decreases rapidly as x increases, approaching the x-axis but never reaching it, which matches the shape of a reciprocal function of the form $f(x)=\frac{a}{x}$ (for positive $a$, as x increases, y decreases toward 0).

Snap & solve any problem in the app
Get step-by-step solutions on Sovi AI
Photo-based solutions with guided steps
Explore more problems and detailed explanations
(a) cubic function, of the form $f(x) = ax^3 + bx^2 + cx + d$
(b) reciprocal function, of the form $f(x) = \frac{a}{x}$