QUESTION IMAGE
Question
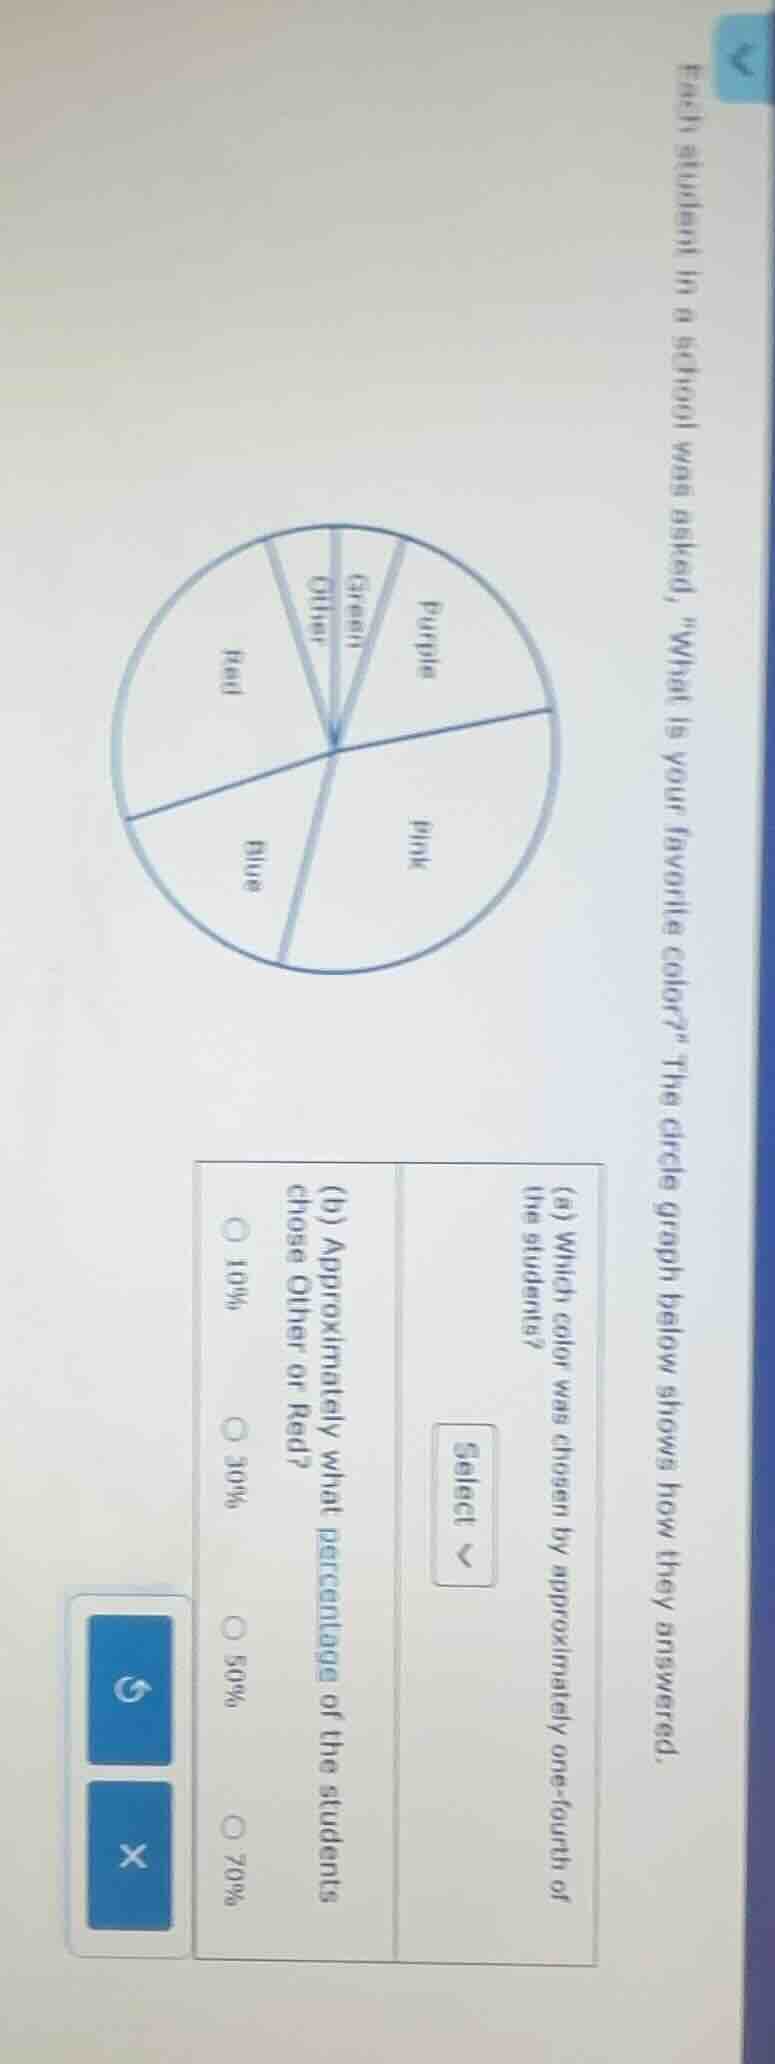
each student in a school was asked, \what is your favorite color?\ the circle graph below shows how they answered.
(a) which color was chosen by approximately one - fourth of the students?
(b) approximately what percentage of the students chose other or red?
options for (b): 10%, 30%, 50%, 70%
Part (a)
Step1: Recall one - fourth of a circle
One - fourth of a circle (in terms of a pie chart) corresponds to a sector with a central angle of $90^{\circ}$ (since a full circle is $360^{\circ}$ and $\frac{1}{4}\times360^{\circ}=90^{\circ}$) or a sector that looks like a quarter of the circle. Looking at the pie chart, the "Pink" sector appears to be approximately a quarter of the circle.
Step2: Identify the color
By visually inspecting the pie chart, the sector for "Pink" seems to occupy about one - fourth of the total area of the circle.
Step1: Analyze the sectors for "Other" and "Red"
First, we estimate the percentage of the circle occupied by "Other" and "Red" together. The "Red" sector is a significant portion, and the "Other" sector is small, but when combined, we can compare with the given options.
Step2: Estimate the percentage
A full circle is $100\%$. The "Red" sector and "Other" sector together: the "Red" sector looks like it's around, say, $25\%$ and "Other" is a small part, but when combined, looking at the options, $30\%$ is a reasonable estimate. The $10\%$ is too small, $50\%$ is too big (since half the circle is already taken by "Pink" maybe, and other sectors are there), and $70\%$ is way too big.

Snap & solve any problem in the app
Get step-by-step solutions on Sovi AI
Photo-based solutions with guided steps
Explore more problems and detailed explanations
Pink