QUESTION IMAGE
Question
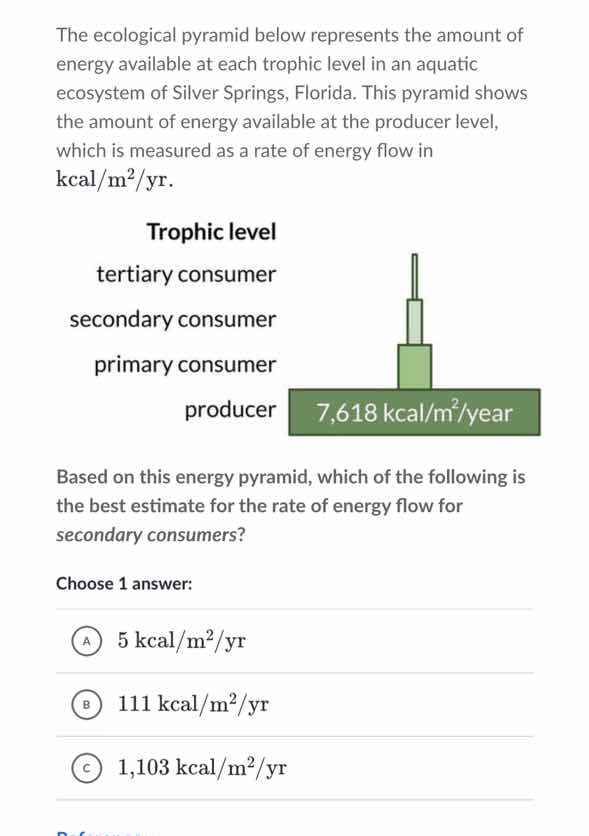
the ecological pyramid below represents the amount of energy available at each trophic level in an aquatic ecosystem of silver springs, florida. this pyramid shows the amount of energy available at the producer level, which is measured as a rate of energy flow in kcal/m²/yr. trophic level tertiary consumer secondary consumer primary consumer producer 7,618 kcal/m²/year based on this energy pyramid, which of the following is the best estimate for the rate of energy flow for secondary consumers? choose 1 answer: a 5 kcal/m²/yr b 111 kcal/m²/yr c 1,103 kcal/m²/yr
Step1: Recall energy pyramid rule
In an energy pyramid, typically about 10% of energy is transferred from one trophic level to the next. Producers are at the base, then primary consumers, then secondary consumers, then tertiary consumers.
Step2: Calculate energy for primary consumers
First, find energy for primary consumers: 10% of producer energy. Producer energy is \( 7618 \, \text{kcal/m}^2/\text{yr} \). 10% of that is \( 0.1 \times 7618 = 761.8 \, \text{kcal/m}^2/\text{yr} \) (approximate primary consumer energy).
Step3: Calculate energy for secondary consumers
Now, secondary consumers get 10% of primary consumer energy. So 10% of \( 761.8 \) is \( 0.1 \times 761.8 = 76.18 \, \text{kcal/m}^2/\text{yr} \). Looking at the options, 111 is close (maybe slight variation in energy transfer efficiency, but 111 is the closest reasonable estimate among the options, as 5 is too low and 1103 is too high).

Snap & solve any problem in the app
Get step-by-step solutions on Sovi AI
Photo-based solutions with guided steps
Explore more problems and detailed explanations
B. 111 kcal/m²/yr