QUESTION IMAGE
Question
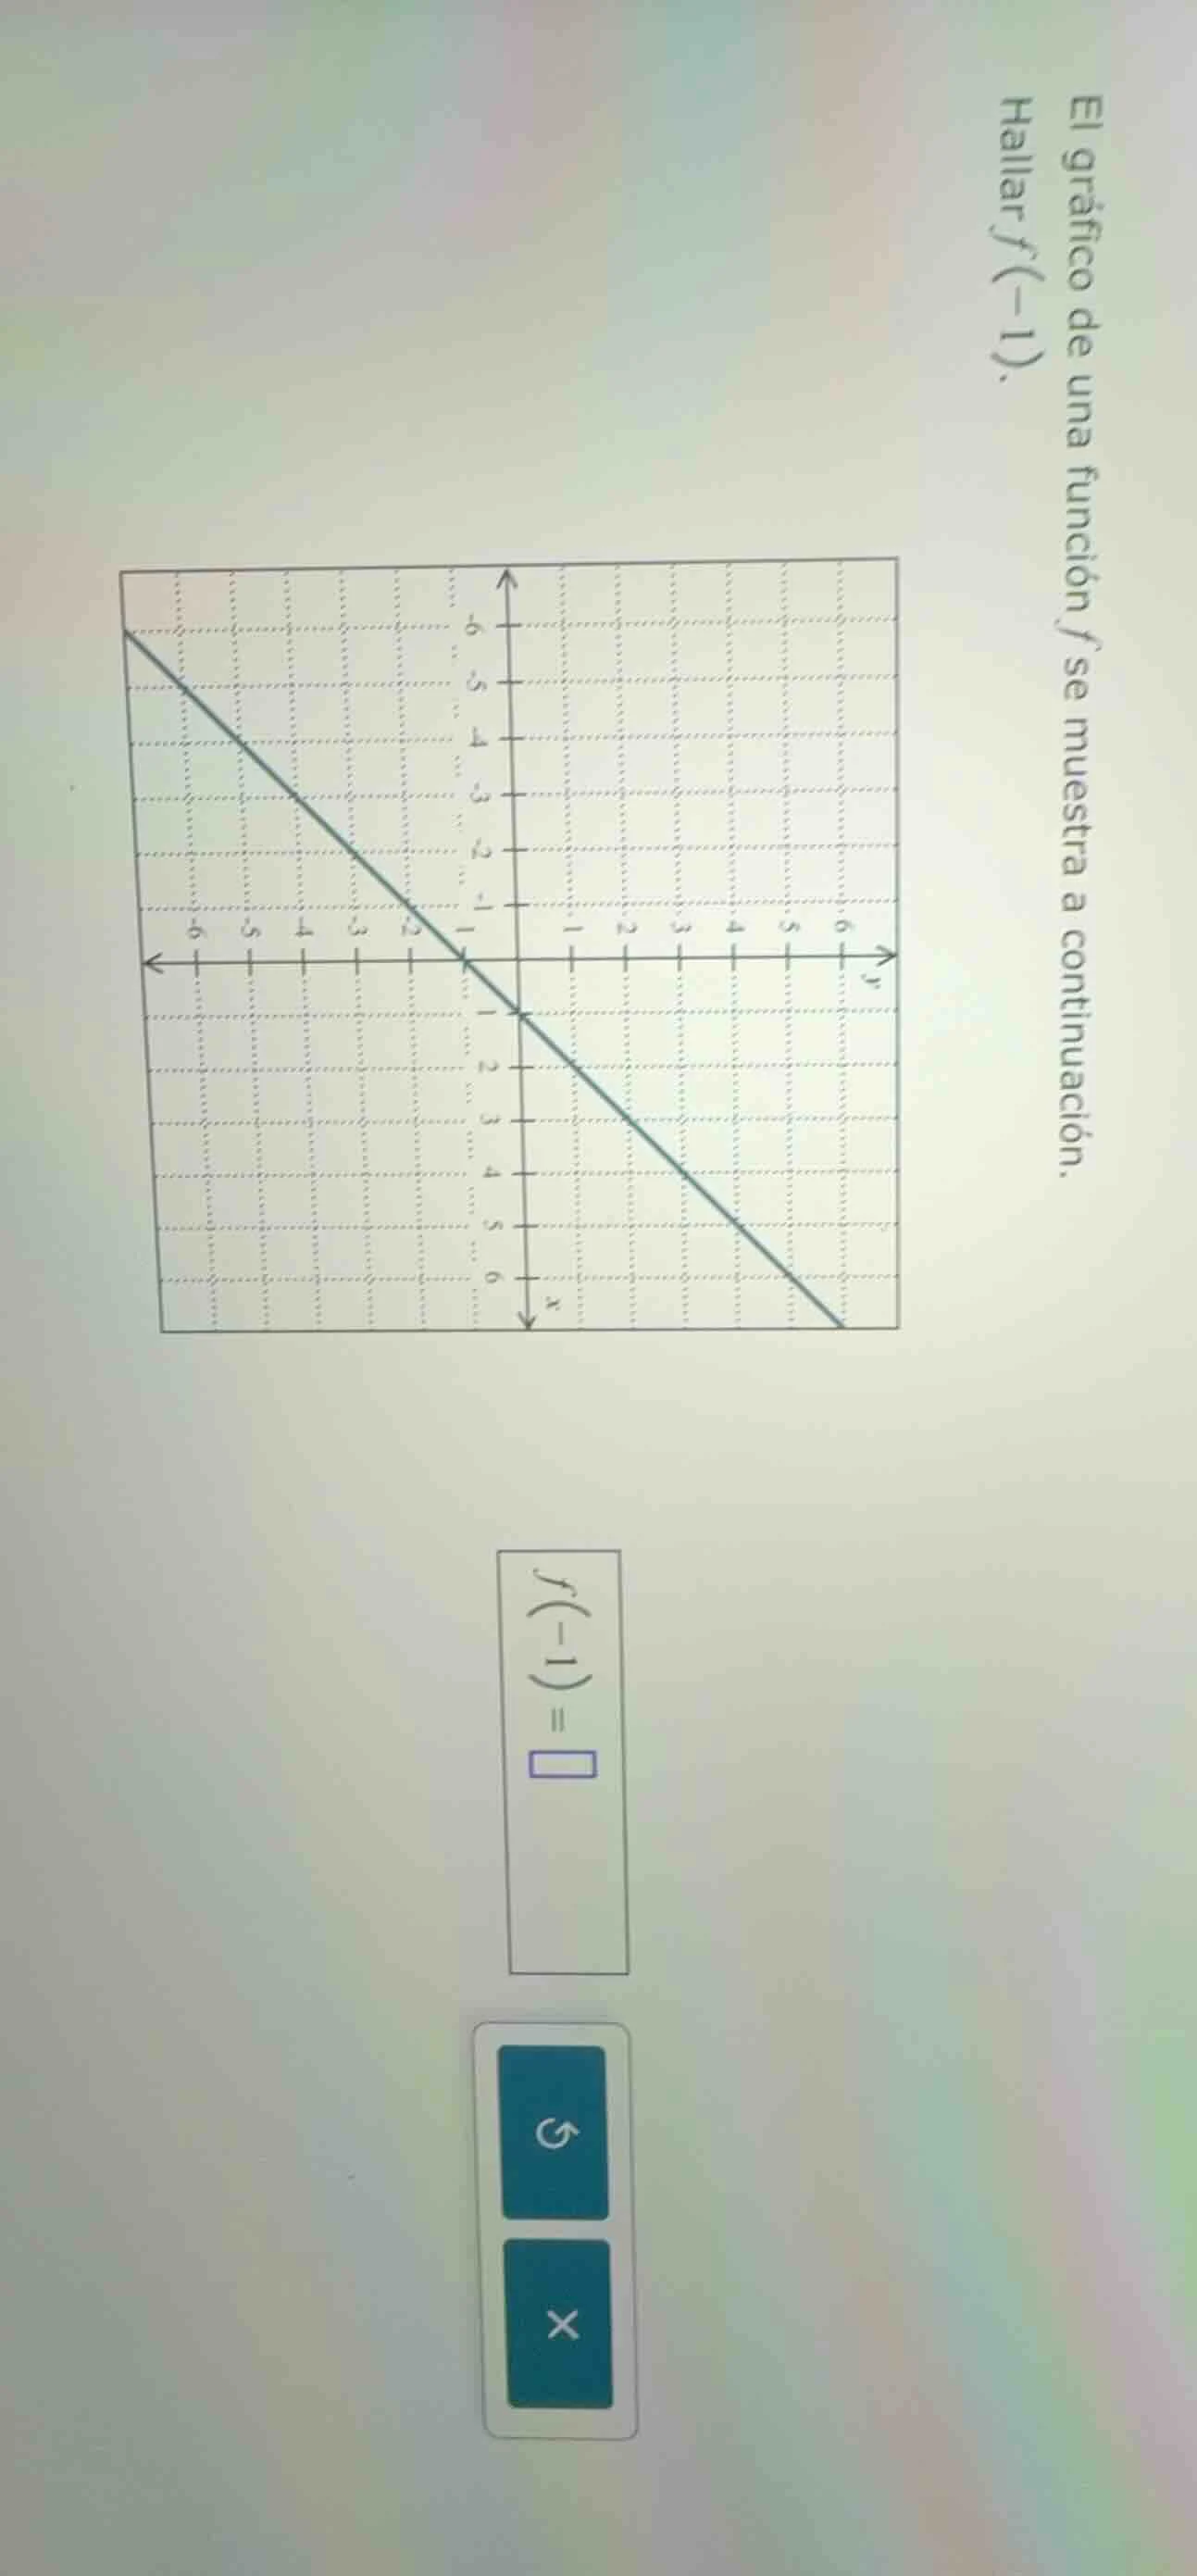
el gráfico de una función ( f ) se muestra a continuación. hallar ( f(-1) ). ( f(-1) = square )
Step1: Understand the problem
We need to find the value of the function \( f(x) \) when \( x = -1 \) from the given graph. This means we look for the point on the graph where the \( x \)-coordinate is \( -1 \) and then find the corresponding \( y \)-coordinate, which is \( f(-1) \).
Step2: Locate \( x = -1 \) on the graph
On the coordinate plane, find the vertical line corresponding to \( x = -1 \). Then, find the point where the graph of the function intersects this vertical line.
Step3: Determine the \( y \)-coordinate
From the graph, when we look at \( x = -1 \), the graph passes through the point \( (-1, 0) \)? Wait, no, let's check again. Wait, looking at the grid, when \( x = -1 \), the line passes through \( (-1, 0) \)? Wait, no, maybe I misread. Wait, let's see the graph: the line seems to pass through \( (0, 1) \) and other points. Wait, no, let's check the coordinates. Wait, the \( x \)-axis and \( y \)-axis: the horizontal axis is \( x \), vertical is \( y \). Wait, when \( x = -1 \), the point on the line: let's see the slope. Wait, maybe the line has a slope. Wait, alternatively, looking at the graph, when \( x = -1 \), the \( y \)-coordinate (the value of \( f(-1) \)) is 0? Wait, no, wait the graph: let's see the intersection. Wait, the line passes through \( (-1, 0) \)? Wait, maybe I made a mistake. Wait, let's look again. Wait, the graph: when \( x = -1 \), the point is at \( y = 0 \)? Wait, no, maybe the line is \( y = x + 1 \)? Let's check: when \( x = -1 \), \( y = -1 + 1 = 0 \). Yes, that makes sense. So when \( x = -1 \), \( f(-1) = 0 \)? Wait, no, wait the graph: let's see the points. Wait, the line goes through \( (-1, 0) \), \( (0, 1) \), \( (1, 2) \), etc. So the slope is 1, and the equation is \( y = x + 1 \). So when \( x = -1 \), \( y = -1 + 1 = 0 \). Wait, but maybe I misread. Wait, no, let's check the graph again. The user's graph: the line passes through \( (-1, 0) \)? Wait, maybe. So the \( y \)-coordinate at \( x = -1 \) is 0? Wait, no, wait the original graph: let's see, the grid lines. Each square is 1 unit. So when \( x = -1 \), the line is at \( y = 0 \)? Wait, maybe. So \( f(-1) = 0 \)? Wait, no, wait maybe I made a mistake. Wait, let's check again. Wait, the graph: the line starts from the top left, goes down to the bottom right? Wait, no, the arrow: the \( x \)-axis arrow is to the right, \( y \)-axis up. Wait, the line: when \( x \) increases, \( y \) increases? Wait, no, the slope: let's take two points. Let's take \( (0, 1) \) and \( (1, 2) \): slope is \( (2 - 1)/(1 - 0) = 1 \). So equation is \( y = x + 1 \). Then when \( x = -1 \), \( y = -1 + 1 = 0 \). So \( f(-1) = 0 \).

Snap & solve any problem in the app
Get step-by-step solutions on Sovi AI
Photo-based solutions with guided steps
Explore more problems and detailed explanations
\( 0 \)