QUESTION IMAGE
Question
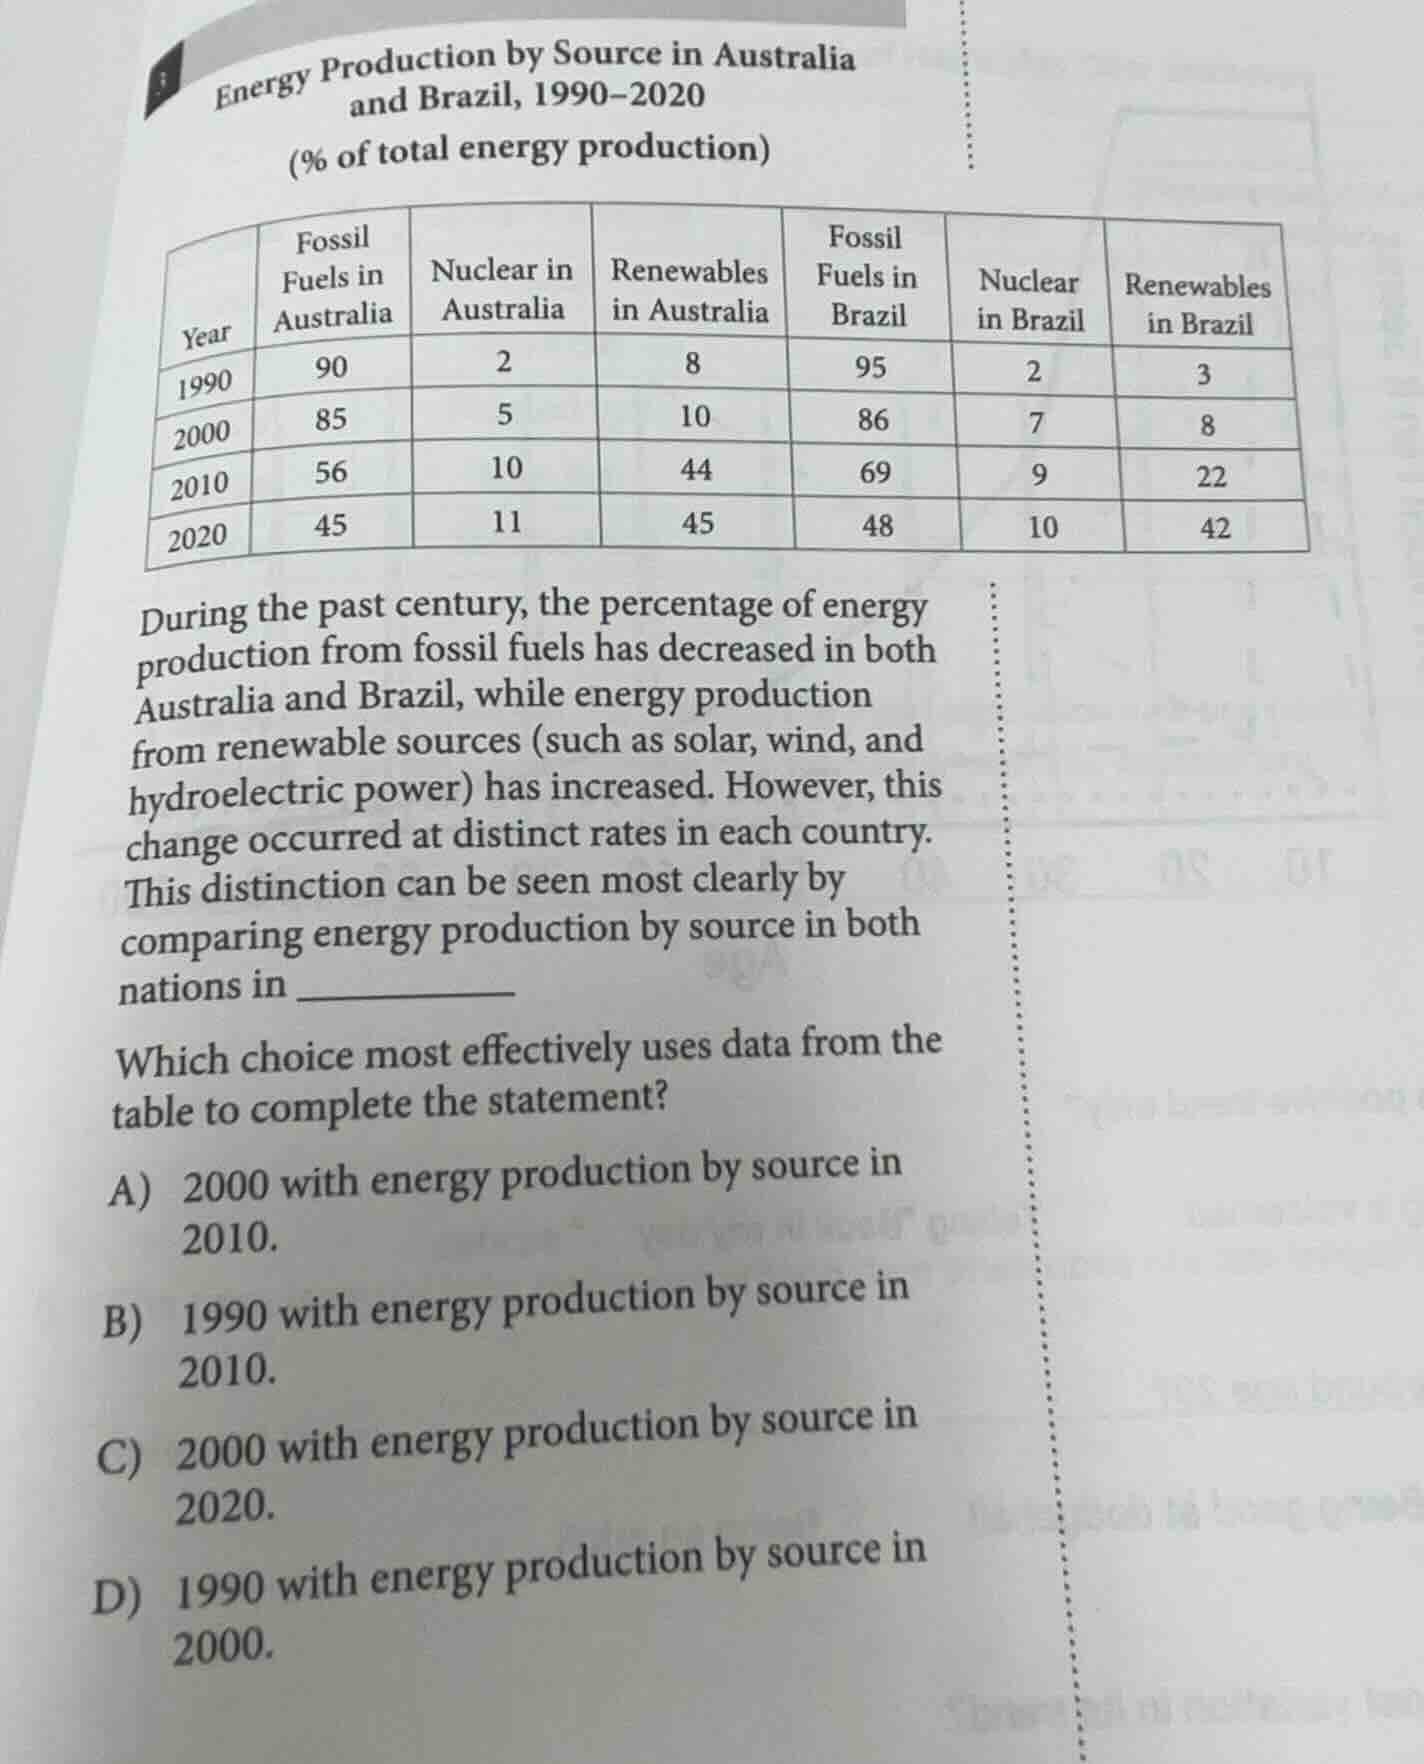
energy production by source in australia and brazil, 1990-2020(% of total energy production)| year | fossil fuels in australia | nuclear in australia | renewables in australia | fossil fuels in brazil | nuclear in brazil | renewables in brazil ||------|----------------------------|----------------------|--------------------------|-------------------------|-------------------|-----------------------|| 1990 | 90 | 2 | 8 | 95 | 2 | 3 || 2000 | 85 | 5 | 10 | 86 | 7 | 8 || 2010 | 56 | 10 | 44 | 69 | 9 | 22 || 2020 | 45 | 11 | 45 | 48 | 10 | 42 |during the past century, the percentage of energy production from fossil fuels has decreased in both australia and brazil, while energy production from renewable sources (such as solar, wind, and hydroelectric power) has increased. however, this change occurred at distinct rates in each country.this distinction can be seen most clearly by comparing energy production by source in both nations in _______________which choice most effectively uses data from the table to complete the statement?a) 2000 with energy production by source in 2010.b) 1990 with energy production by source in 2010.c) 2000 with energy production by source in 2020.d) 1990 with energy production by source in 2000.
To identify the clearest rate difference, calculate the percentage change for fossil fuels and renewables for each option:
- Option A (2000-2010): Australia fossil: 85→56 (-29%), renewables:10→44 (+340%); Brazil fossil:86→69 (-19.8%), renewables:8→22 (+175%).
- Option B (1990-2010): Australia fossil:90→56 (-37.8%), renewables:8→44 (+450%); Brazil fossil:95→69 (-27.4%), renewables:3→22 (+633%).
- Option C (2000-2020): Australia fossil:85→45 (-47.1%), renewables:10→45 (+350%); Brazil fossil:86→48 (-44.2%), renewables:8→42 (+425%).
- Option D (1990-2000): Australia fossil:90→85 (-5.6%), renewables:8→10 (+25%); Brazil fossil:95→86 (-9.5%), renewables:3→8 (+166.7%).
The largest, most distinct rate changes occur between 1990 and 2010, showing the clearest contrast in how each country shifted energy sources.

Snap & solve any problem in the app
Get step-by-step solutions on Sovi AI
Photo-based solutions with guided steps
Explore more problems and detailed explanations
B) 1990 with energy production by source in 2010.