QUESTION IMAGE
Question
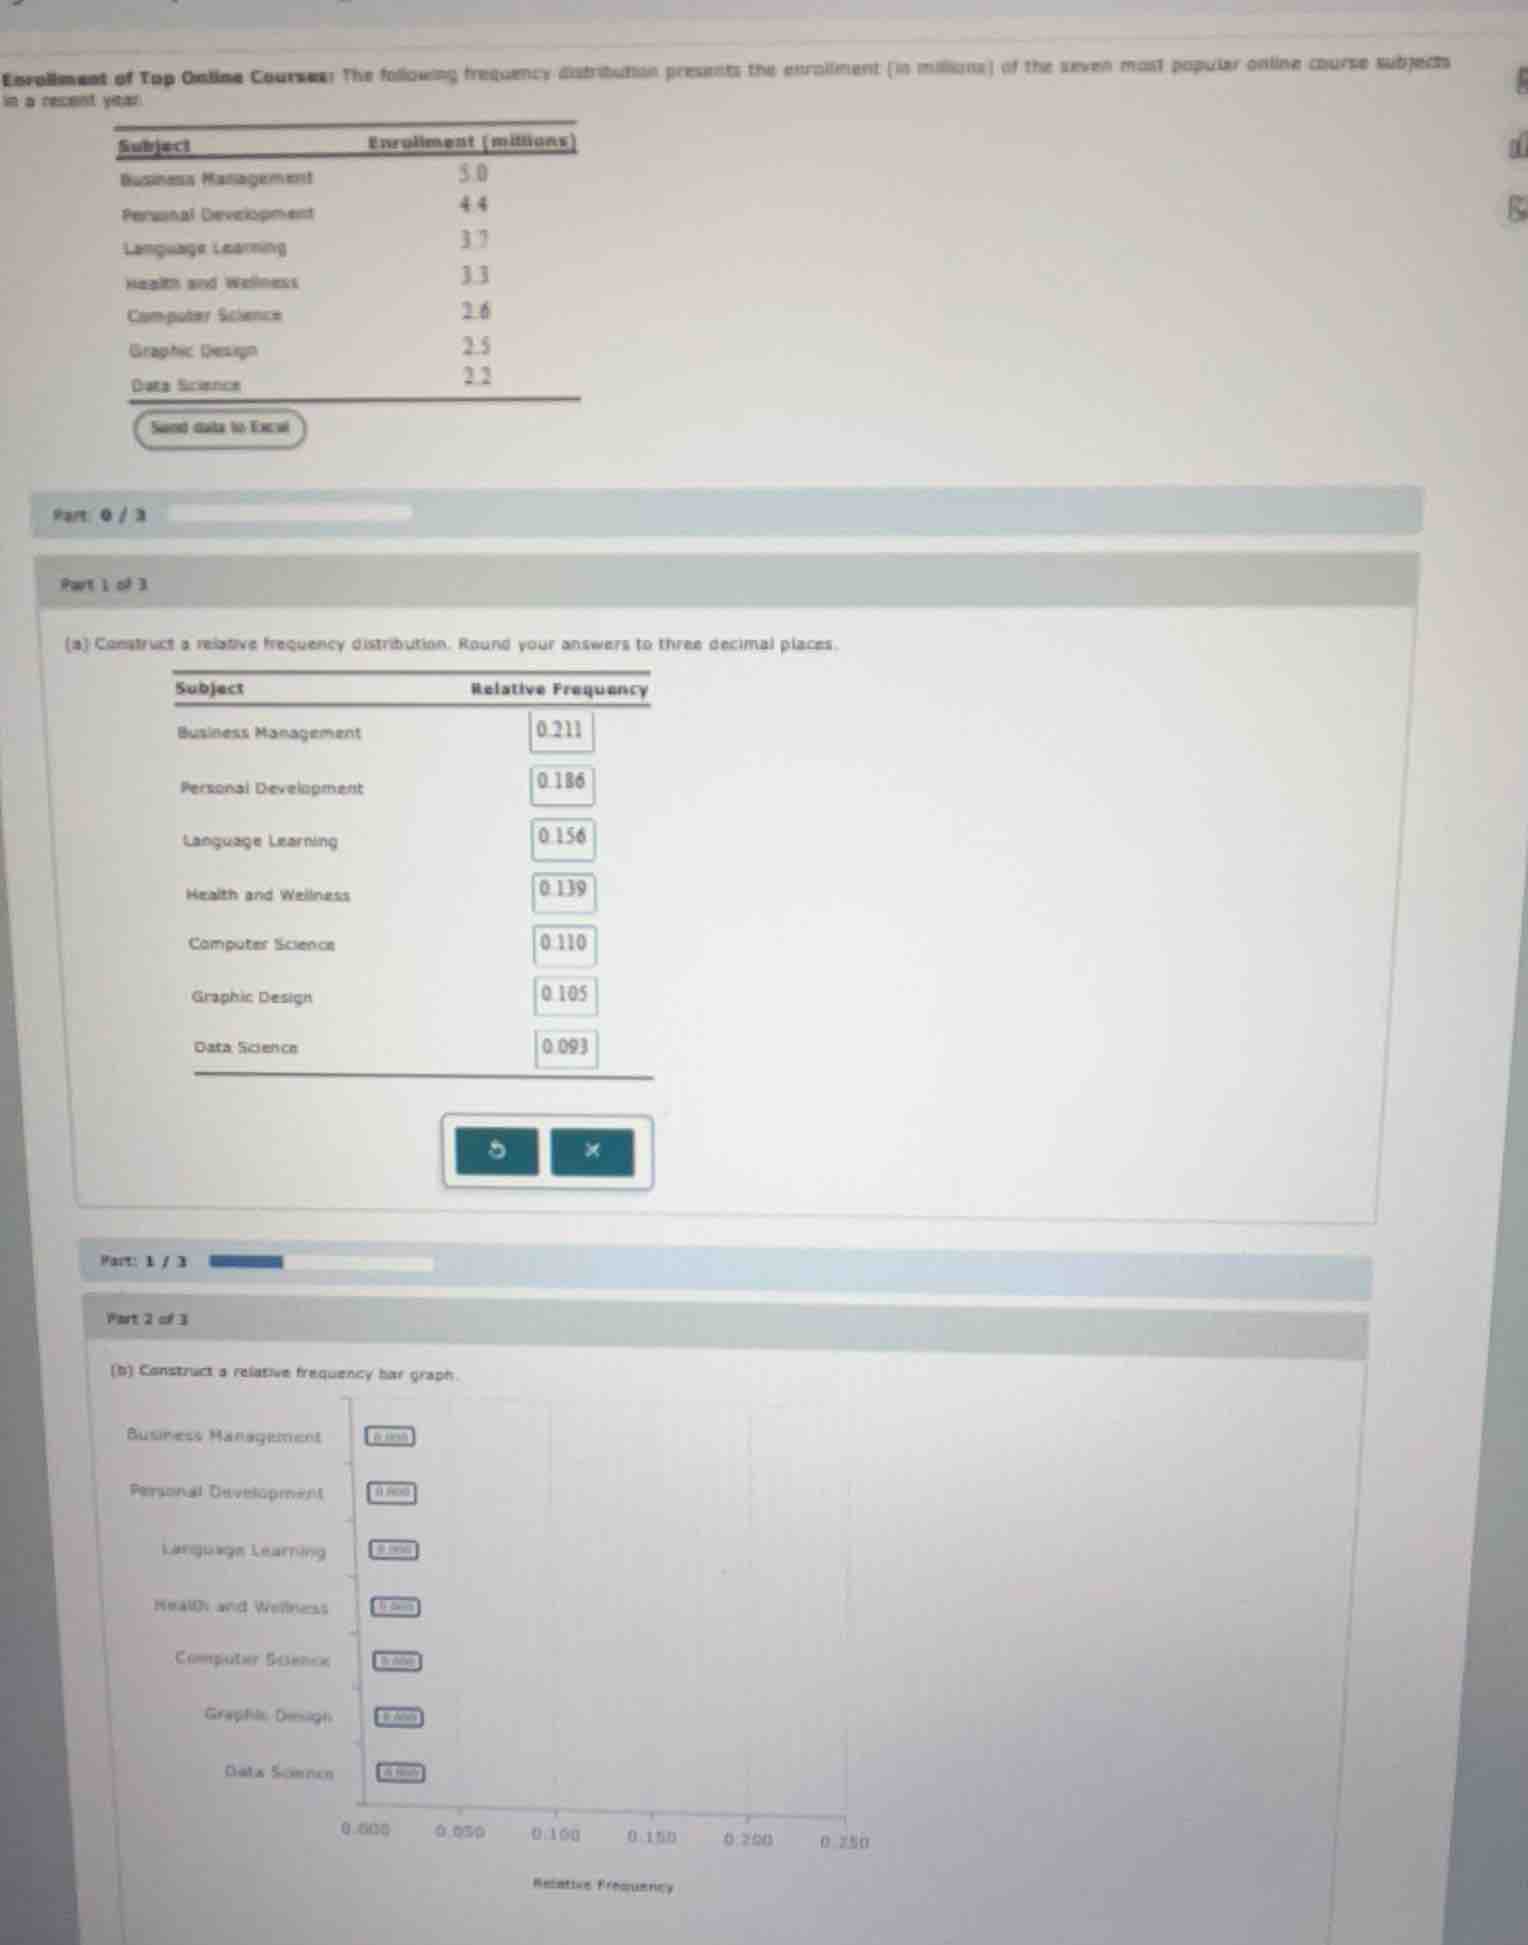
enrollment of top online courses: the following frequency distribution presents the enrollment (in millions) of the seven most popular online course subjects in a recent year.
subject enrollment (millions)
business management 5.0
personal development 4.4
language learning 3.7
health and wellness 3.3
computer science 2.6
graphic design 2.5
data science 2.2
send data to excel
part 0 / 3
part 1 of 3
(a) construct a relative frequency distribution. round your answers to three decimal places.
subject relative frequency
business management 0.211
personal development 0.186
language learning 0.156
health and wellness 0.139
computer science 0.110
graphic design 0.105
data science 0.093
part: 1 / 3
part 2 of 3
(b) construct a relative frequency bar graph.
business management
personal development
language learning
health and wellness
computer science
graphic design
data science
0.000 0.050 0.100 0.150 0.200 0.250
relative frequency

Snap & solve any problem in the app
Get step-by-step solutions on Sovi AI
Photo-based solutions with guided steps
Explore more problems and detailed explanations
(b) The relative frequency bar graph should have horizontal bars with lengths corresponding to the relative frequencies calculated in Part (a): Business Management: $0.211$, Personal Development: $0.186$, Language Learning: $0.156$, Health and Wellness: $0.139$, Computer Science: $0.110$, Graphic Design: $0.105$, and Data Science: $0.093$.