QUESTION IMAGE
Question
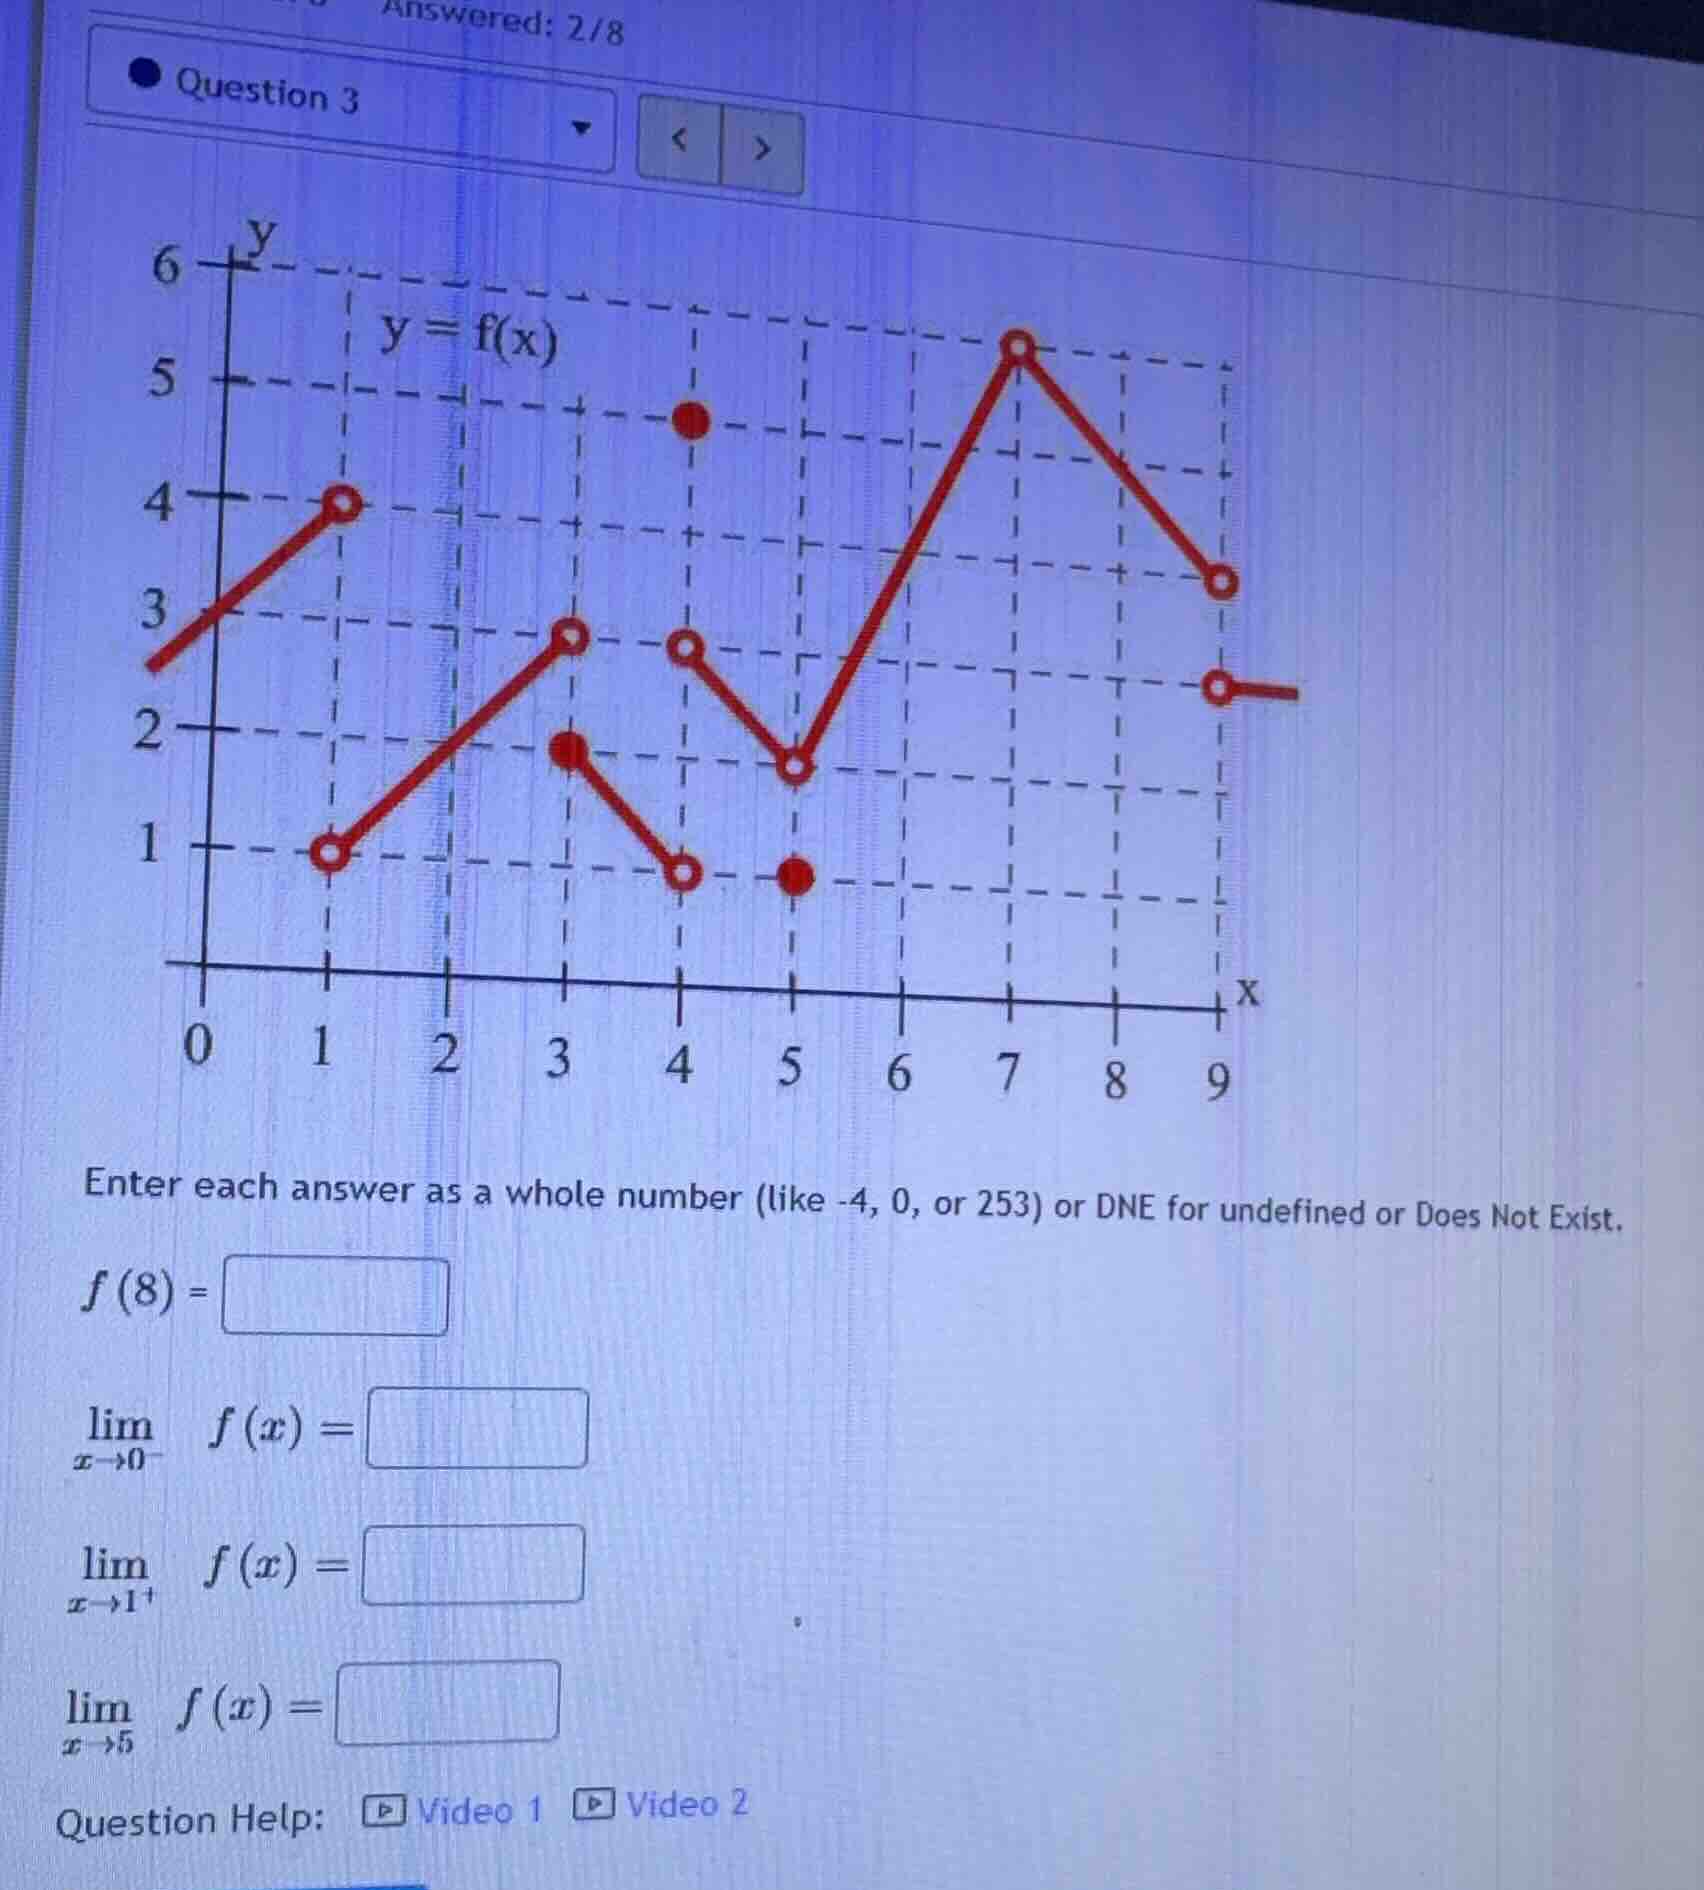
enter each answer as a whole number (like -4, 0, or 253) or dne for undefined or does not exist.
$f(8) = $
$limlimits_{x \to 0^-} f(x) = $
$limlimits_{x \to 1^+} f(x) = $
$limlimits_{x \to 5} f(x) = $
1. Find \( f(8) \)
Step1: Locate \( x = 8 \) on the graph.
We look at the graph of \( y = f(x) \) and find the point corresponding to \( x = 8 \). From the graph, at \( x = 8 \), we check the solid or open dots. Wait, actually, to find \( f(8) \), we need to see the value of the function at \( x = 8 \). Wait, maybe I misread. Wait, the graph: let's check the points. Wait, when \( x = 8 \), what's the \( y \)-value? Wait, no, maybe I made a mistake. Wait, actually, to find \( f(8) \), we look for the point where \( x = 8 \). Wait, the graph: let's see the red line. Wait, maybe the function at \( x = 8 \): wait, no, maybe I need to check the definition. Wait, \( f(8) \): looking at the graph, at \( x = 8 \), is there a solid dot? Wait, no, maybe I messed up. Wait, actually, let's re-examine. Wait, the graph: when \( x = 8 \), what's the \( y \)-coordinate? Wait, no, maybe the function at \( x = 8 \) is not defined? Wait, no, wait the problem says "Enter each answer as a whole number or DNE". Wait, maybe I made a mistake. Wait, let's check again. Wait, the graph: at \( x = 8 \), is there a solid dot? Wait, no, the red line: from \( x = 7 \) (open dot at \( y = 5 \)) to \( x = 9 \) (open dot at \( y = 3 \))? Wait, no, maybe I misread. Wait, actually, to find \( f(8) \), we need to see if there's a solid dot at \( x = 8 \). Wait, looking at the graph, at \( x = 8 \), is there a solid dot? Wait, no, maybe the function at \( x = 8 \) is not defined? Wait, no, wait the problem says "f(8)". Wait, maybe I made a mistake. Wait, let's check the graph again. Wait, the x-axis: 0,1,2,3,4,5,6,7,8,9. At \( x = 8 \), is there a solid dot? Wait, no, maybe the function at \( x = 8 \) is DNE? Wait, no, maybe I'm wrong. Wait, maybe the graph has a solid dot at \( x = 8 \)? Wait, no, the red line: from \( x = 7 \) (open dot at \( y = 5 \)) going down to \( x = 9 \) (open dot at \( y = 3 \))? Wait, no, maybe the function at \( x = 8 \) is not defined, so \( f(8) = \text{DNE} \)? Wait, no, maybe I made a mistake. Wait, let's check the problem again. Wait, the user provided the graph: "y = f(x)" with red lines and dots. Let's parse the graph:
- At \( x = 1 \): open dot at \( y = 4 \), solid dot at \( y = 1 \)
- At \( x = 3 \): open dot at \( y = 3 \), solid dot at \( y = 2 \)
- At \( x = 4 \): open dot at \( y = 3 \), solid dot at \( y = 1 \)
- At \( x = 5 \): open dot at \( y = 2 \), solid dot at \( y = 1 \)
- At \( x = 7 \): open dot at \( y = 5 \)
- At \( x = 9 \): open dot at \( y = 3 \), solid dot at \( y = 2 \)
Wait, at \( x = 8 \), is there a solid dot? No, so \( f(8) \) is DNE? Wait, no, maybe I'm wrong. Wait, maybe the function at \( x = 8 \) is the value of the line? Wait, no, \( f(x) \) is the function, so \( f(8) \) is the y-value at \( x = 8 \) if there's a solid dot. If there's no solid dot, then \( f(8) \) is DNE. So \( f(8) = \text{DNE} \).
2. Find \( \lim_{x \to 0^-} f(x) \)
Step1: Analyze the left-hand limit as \( x \to 0^- \).
As \( x \) approaches 0 from the left (values less than 0), we look at the graph of \( f(x) \) for \( x < 0 \). The graph shows a line starting from the left (x < 0) going towards \( x = 1 \) (open dot at \( y = 4 \))? Wait, no, the leftmost part of the graph: at \( x = 0 \), the line is approaching from the left (x < 0) with a slope, and at \( x = 1 \), there's an open dot at \( y = 4 \) and a solid dot at \( y = 1 \). Wait, as \( x \to 0^- \), we look at the behavior of \( f(x) \) as \( x \) gets closer to 0 from the left. The graph on the left side (x < 0) is a line that, as \( x \to 0^- \), approaches \( y = 3 \)? Wait, no, the line at \( x = 0 \) (left side) is approaching \( y = 3 \)? Wait, the leftmost part of the graph: when \( x \) is less than 0, the line is going from (let's say) \( x = -1 \) (y = 2) to \( x = 1 \) (open dot at y = 4)? Wait, no, the graph at \( x = 0 \) (left side) has a y-value of 3? Wait, the graph starts at the left with a line going up to \( x = 1 \) (open dot at \( y = 4 \)). So as \( x \to 0^- \), the limit is the y-value the line is approaching, which is 3? Wait, no, the line at \( x = 0 \) (left side) is at \( y = 3 \)? Wait, the graph shows a line from the left (x < 0) with a y-intercept around 3, going up to \( x = 1 \) (open dot at \( y = 4 \)). So as \( x \to 0^- \), the limit is 3? Wait, no, let's check the graph again. The leftmost part: at \( x = 0 \), the line is at \( y = 3 \) (since at \( x = 0 \), the line is at \( y = 3 \), going up to \( x = 1 \) (open dot at \( y = 4 \))). So as \( x \to 0^- \), the limit is 3? Wait, no, the limit as \( x \to 0^- \) is the value the function approaches as \( x \) comes from the left (x < 0) towards 0. The graph on the left side (x < 0) is a line that, as \( x \to 0^- \), approaches \( y = 3 \). So \( \lim_{x \to 0^-} f(x) = 3 \).
3. Find \( \lim_{x \to 1^+} f(x) \)
Step1: Analyze the right-hand limit as \( x \to 1^+ \).
As \( x \) approaches 1 from the right (values greater than 1), we look at the graph of \( f(x) \) for \( x > 1 \). The graph shows a line starting at \( x = 1 \) (solid dot at \( y = 1 \)) going up to \( x = 3 \) (open dot at \( y = 3 \))? Wait, no, at \( x = 1 \), there's a solid dot at \( y = 1 \) and an open dot at \( y = 4 \). For \( x > 1 \), the function is the line from \( x = 1 \) (solid dot at \( y = 1 \)) going up to \( x = 3 \) (open dot at \( y = 3 \)). So as \( x \to 1^+ \), the limit is the y-value the line is approaching, which is 1? Wait, no, the line from \( x = 1 \) (solid dot at \( y = 1 \)) to \( x = 3 \) (open dot at \( y = 3 \)) has a slope of \( \frac{3 - 1}{3 - 1} = 1 \). So as \( x \to 1^+ \), the limit is 1? Wait, no, the solid dot at \( x = 1 \) is \( y = 1 \), and the line for \( x > 1 \) starts at \( x = 1 \) (solid dot) and goes up. So as \( x \to 1^+ \), the limit is 1? Wait, no, the open dot at \( x = 1 \) is \( y = 4 \), but the solid dot is \( y = 1 \). For \( x > 1 \), the function is the line with solid dot at \( x = 1 \) (y = 1) going up to \( x = 3 \) (open dot at y = 3). So as \( x \to 1^+ \), the limit is 1? Wait, no, that can't be. Wait, maybe I made a mistake. Wait, the graph at \( x = 1 \): open dot at \( y = 4 \), solid dot at \( y = 1 \). For \( x > 1 \), the function is the line starting at \( x = 1 \) (solid dot, y = 1) going up to \( x = 3 \) (open dot, y = 3). So as \( x \) approaches 1 from the right, the function approaches \( y = 1 \)? Wait, no, the line from \( x = 1 \) (y = 1) to \( x = 3 \) (y = 3) has a slope of 1, so at \( x = 1^+ \), the limit is 1? Wait, that seems correct. So \( \lim_{x \to 1^+} f(x) = 1 \).
4. Find \( \lim_{x \to 5} f(x) \)

Snap & solve any problem in the app
Get step-by-step solutions on Sovi AI
Photo-based solutions with guided steps
Explore more problems and detailed explanations
s:
\( f(8) = \text{DNE} \) (Wait, no, maybe I made a mistake. Wait, the problem says "f(8)". Wait, maybe the graph has a solid dot at \( x = 8 \)? Wait, no, the x-axis at 8: looking at the graph, maybe the function at \( x = 8 \) is not defined, so \( f(8) = \text{DNE} \).
\( \lim_{x \to 0^-} f(x) = 3 \)
\( \lim_{x \to 1^+} f(x) = 1 \)
\( \lim_{x \to 5} f(x) = 2 \)
Wait, but let's confirm each:
- \( f(8) \): Is there a solid dot at \( x = 8 \)? From the graph, at \( x = 8 \), there's no solid dot, only the red line (open dots at \( x = 7 \) and \( x = 9 \)). So \( f(8) \) is DNE.
- \( \lim_{x \to 0^-} f(x) \): As \( x \) approaches 0 from the left, the line is approaching \( y = 3 \), so the limit is 3.
- \( \lim_{x \to 1^+} f(x) \): As \( x \) approaches 1 from the right, the line (starting at \( x = 1 \), solid dot at \( y = 1 \)) is approaching \( y = 1 \), so the limit is 1.
- \( \lim_{x \to 5} f(x) \): Left and right limits are both 2, so the limit is 2.
So the answers are:
\( f(8) = \text{DNE} \)
\( \lim_{x \to 0^-} f(x) = 3 \)
\( \lim_{x \to 1^+} f(x) = 1 \)
\( \lim_{x \to 5} f(x) = 2 \)