QUESTION IMAGE
Question
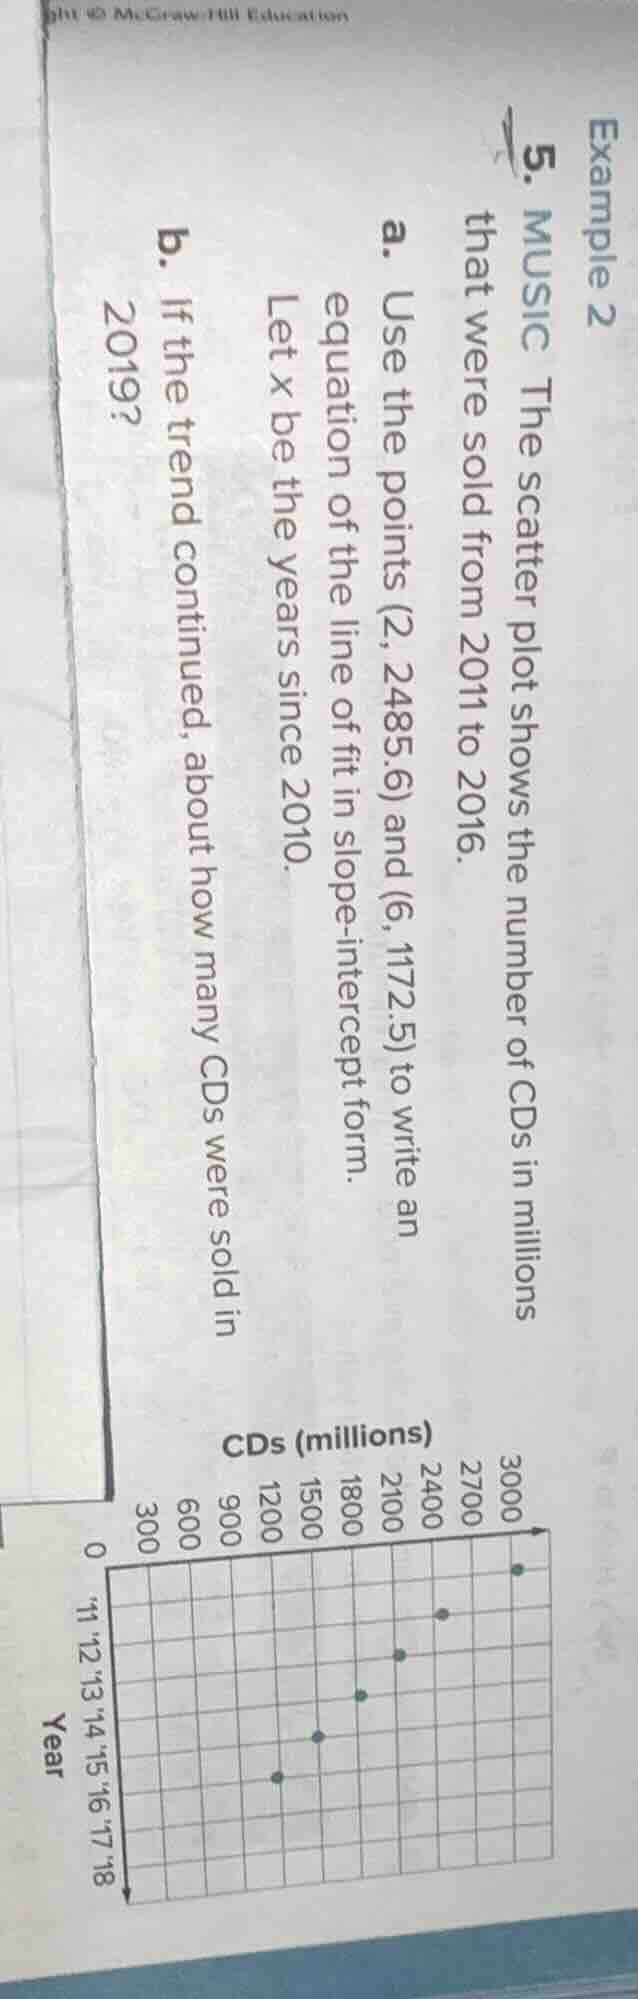
example 2
- music the scatter plot shows the number of cds in millions that were sold from 2011 to 2016.
a. use the points (2, 2485.6) and (6, 1172.5) to write an equation of the line of fit in slope-intercept form.
let x be the years since 2010.
b. if the trend continued, about how many cds were sold in 2019?
Step1: Calculate slope of the line
The slope formula is $m=\frac{y_2-y_1}{x_2-x_1}$. Substitute $(x_1,y_1)=(2,2485.6)$ and $(x_2,y_2)=(6,1172.5)$:
$m=\frac{1172.5-2485.6}{6-2}=\frac{-1313.1}{4}=-328.275$
Step2: Find y-intercept (b)
Use slope-intercept form $y=mx+b$, substitute $m=-328.275$ and $(x,y)=(2,2485.6)$:
$2485.6 = -328.275(2) + b$
$2485.6 = -656.55 + b$
$b=2485.6+656.55=3142.15$
Step3: Write the line equation
Combine slope and intercept into $y=mx+b$:
$y=-328.275x+3142.15$
Step4: Calculate x for 2019
x is years since 2010, so $2019-2010=9$
Step5: Predict 2019 CD sales
Substitute $x=9$ into the line equation:
$y=-328.275(9)+3142.15$
$y=-2954.475+3142.15=187.675$

Snap & solve any problem in the app
Get step-by-step solutions on Sovi AI
Photo-based solutions with guided steps
Explore more problems and detailed explanations
a. $y = -328.275x + 3142.15$
b. About 187.68 million CDs (or 187.675 million CDs)