QUESTION IMAGE
Question
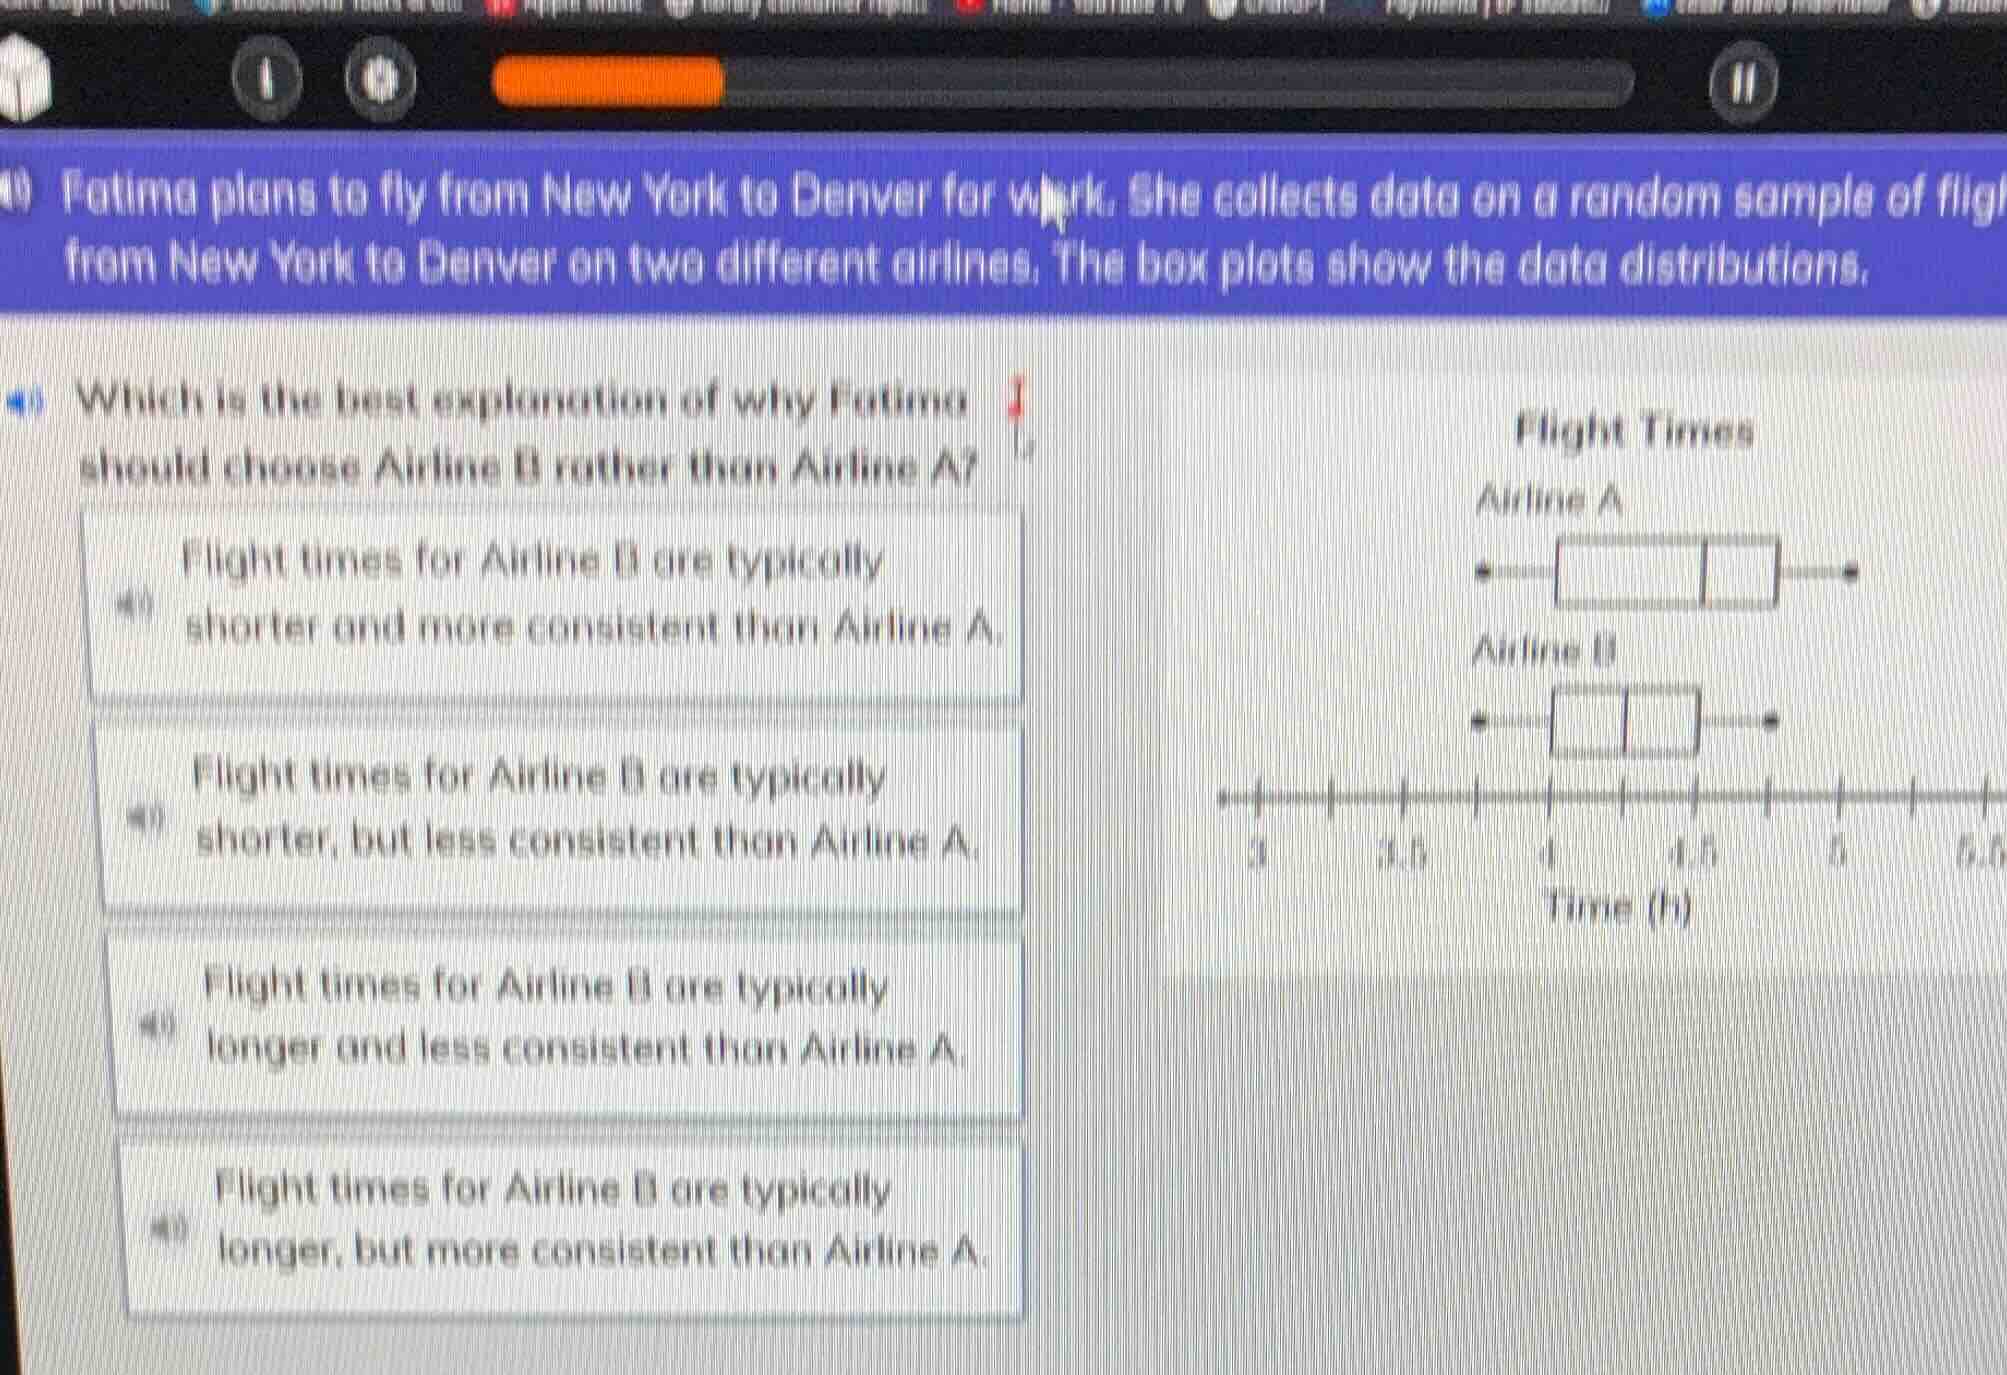
fatima plans to fly from new york to denver for work. she collects data on a random sample of flig from new york to denver on two different airlines. the box plots show the data distributions. which is the best explanation of why fatima should choose airline b rather than airline a? flight times for airline b are typically shorter and more consistent than airline a. flight times for airline b are typically shorter, but less consistent than airline a. flight times for airline b are typically longer and less consistent than airline a. flight times for airline b are typically longer, but more consistent than airline a.
To determine why Fatima should choose Airline B, we analyze the box - plots:
- Center (Typical Value): The median (middle line of the box) of Airline B's flight times is lower than that of Airline A. This means that on average, the flight times for Airline B are shorter.
- Spread (Consistency): The inter - quartile range (IQR, the length of the box) and the overall range (from minimum to maximum) of Airline B's flight times are smaller than those of Airline A. A smaller spread indicates more consistent flight times.
So, flight times for Airline B are typically shorter and more consistent than Airline A.

Snap & solve any problem in the app
Get step-by-step solutions on Sovi AI
Photo-based solutions with guided steps
Explore more problems and detailed explanations
Flight times for Airline B are typically shorter and more consistent than Airline A.