QUESTION IMAGE
Question
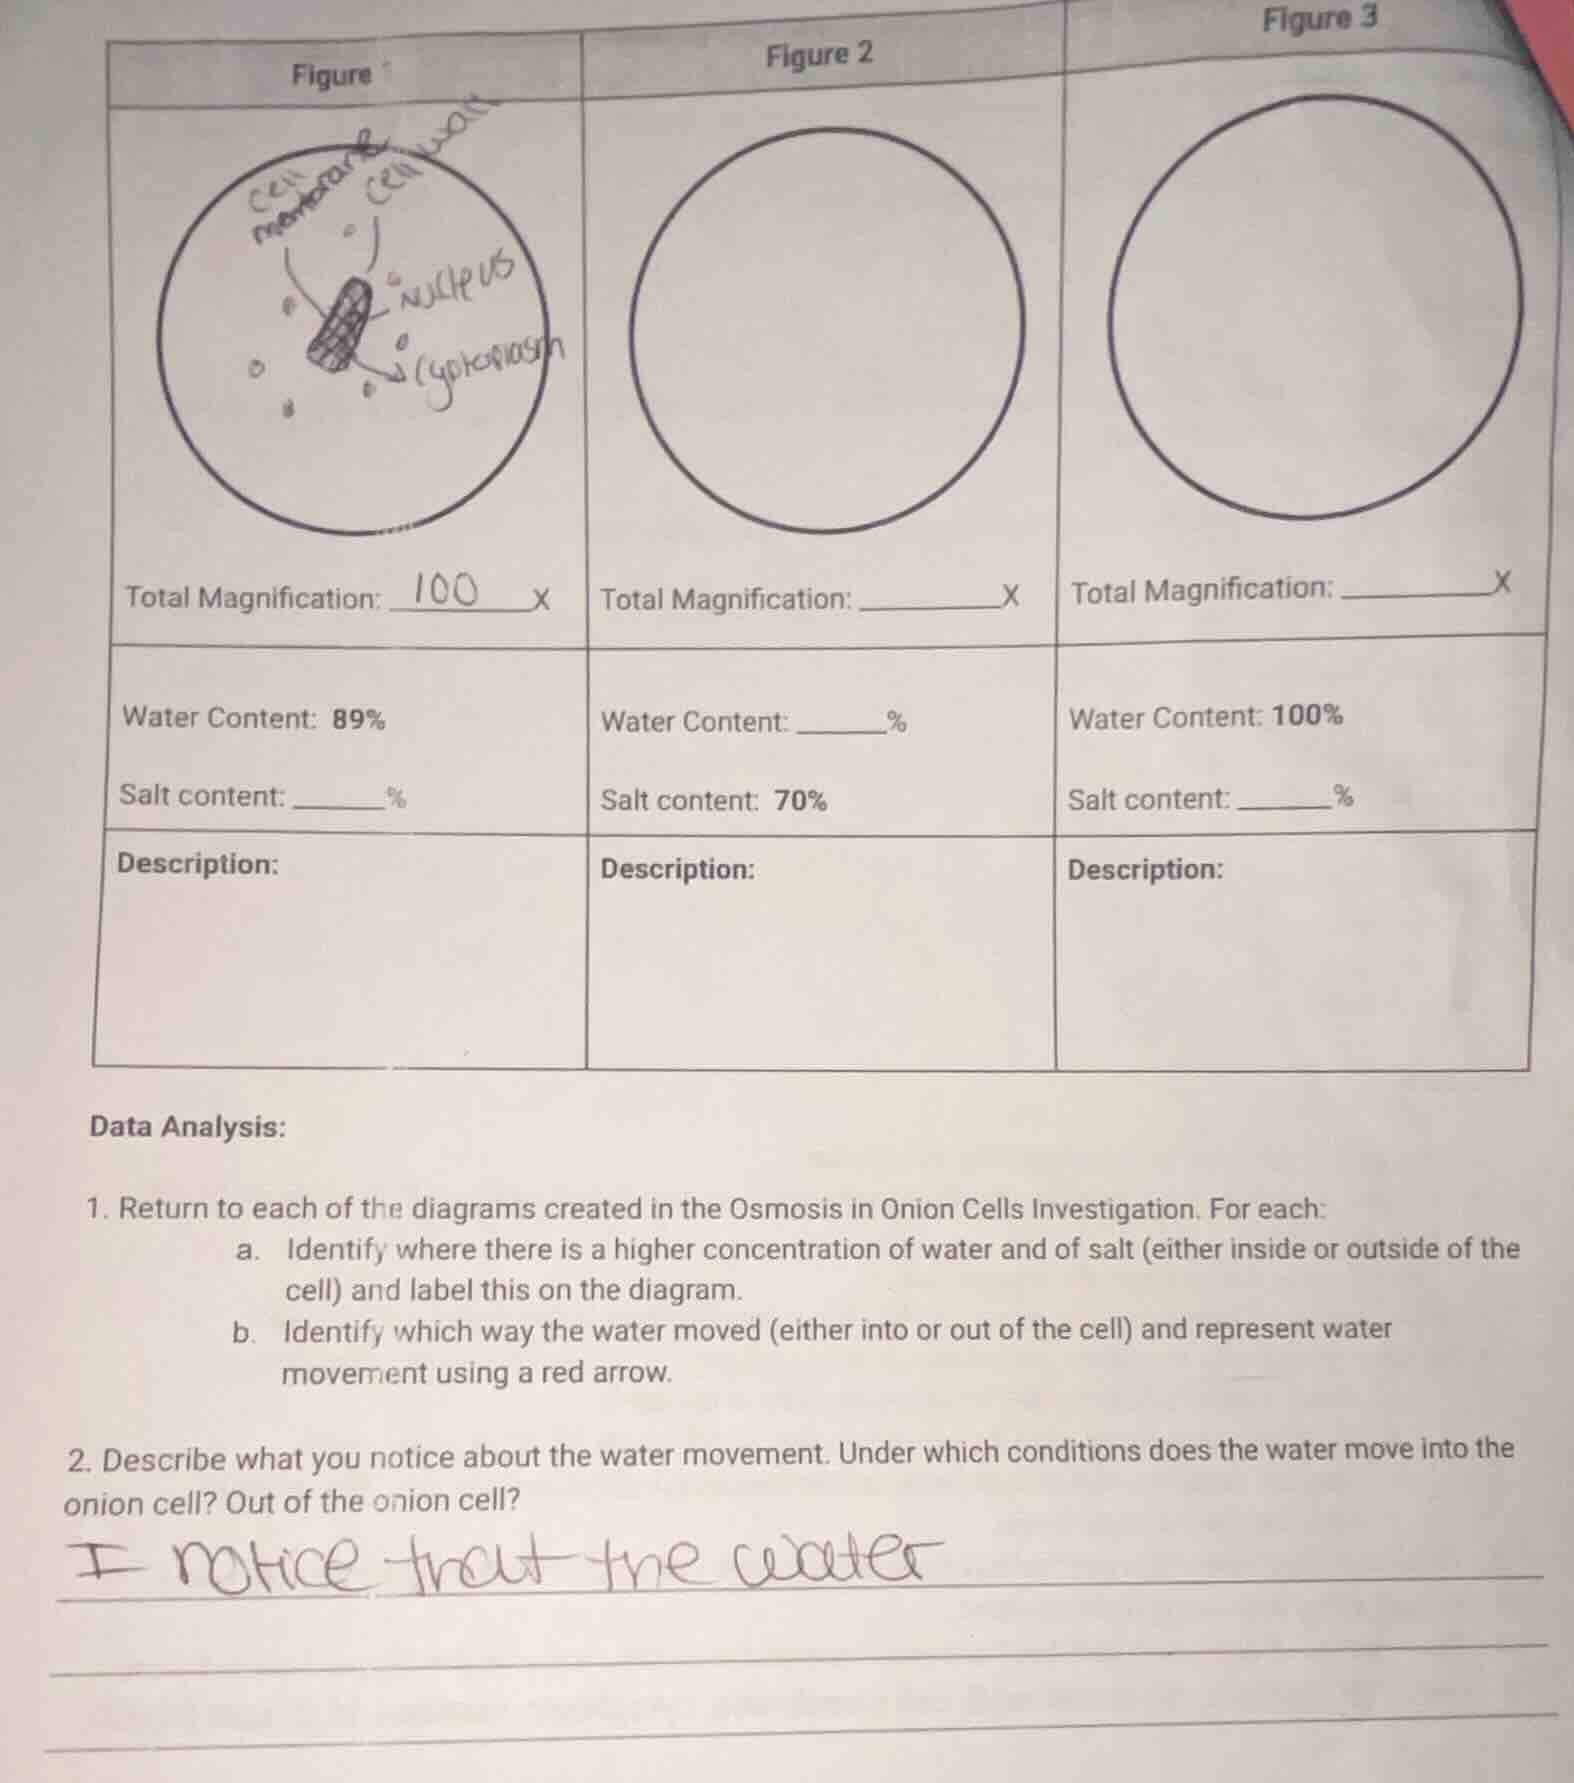
figure
total magnification: 100 x
water content: 89%
salt content: ______%
description:
figure 2
total magnification: ______x
water content: ______%
salt content: 70%
description:
figure 3
total magnification: ______x
water content: 100%
salt content: ______%
description:
data analysis:
- return to each of the diagrams created in the osmosis in onion cells investigation. for each:
a. identify where there is a higher concentration of water and of salt (either inside or outside of the cell) and label this on the diagram.
b. identify which way the water moved (either into or out of the cell) and represent water movement using a red arrow.
- describe what you notice about the water movement. under which conditions does the water move into the onion cell? out of the onion cell?
i notice that the water
Step1: Calculate Figure1 salt content
Assume total content = 100%.
$\text{Salt Content} = 100\% - 89\% = 11\%$
Step2: Calculate Figure2 water content
Assume total content = 100%.
$\text{Water Content} = 100\% - 70\% = 30\%$
Step3: Calculate Figure3 salt content
Assume total content = 100%.
$\text{Salt Content} = 100\% - 100\% = 0\%$
Step4: Fill magnification (standard value)
For onion cell osmosis labs, typical magnification for all views is 100x (10x eyepiece + 10x objective).
Step5: Describe cell states & water movement
Figure1:
- Higher water: inside cell; Higher salt: outside cell (relative)
- Water moves out of cell
- Description: Normal onion cell with visible nucleus, cytoplasm, cell membrane pressed to cell wall.
Figure2:
- Higher water: outside cell; Higher salt: inside cell
- Water moves into cell
- Description: Plasmolyzed onion cell, cell membrane shrank away from cell wall, no visible internal structures.
Figure3:
- Higher water: outside cell; Higher salt: inside cell
- Water moves into cell
- Description: Turgid onion cell, cell membrane firmly pressed to cell wall, no visible internal structures.
Step6: Summarize water movement rules
Water moves to the area of higher solute (salt) concentration.

Snap & solve any problem in the app
Get step-by-step solutions on Sovi AI
Photo-based solutions with guided steps
Explore more problems and detailed explanations
Filled Table Values:
| Category | Figure 1 | Figure 2 | Figure 3 |
|---|---|---|---|
| Water Content | 89% | 30% | 100% |
| Salt Content | 11% | 70% | 0% |
| Description | Normal onion cell with visible nucleus, cytoplasm, cell membrane against cell wall. | Plasmolyzed cell: cell membrane shrank away from cell wall, no visible internal structures. | Turgid cell: cell membrane pressed tightly to cell wall, no visible internal structures. |
| Water Movement Direction | Out of cell | Into cell | Into cell |
| Higher Water Location | Inside cell | Outside cell | Outside cell |
| Higher Salt Location | Outside cell | Inside cell | Inside cell |
Data Analysis 2 Summary:
Water moves across the cell membrane to the region with a higher salt (solute) concentration. Water moves into the onion cell when the water concentration outside the cell is higher (salt concentration lower) than inside. Water moves out of the onion cell when the salt concentration outside the cell is higher (water concentration lower) than inside.