QUESTION IMAGE
Question
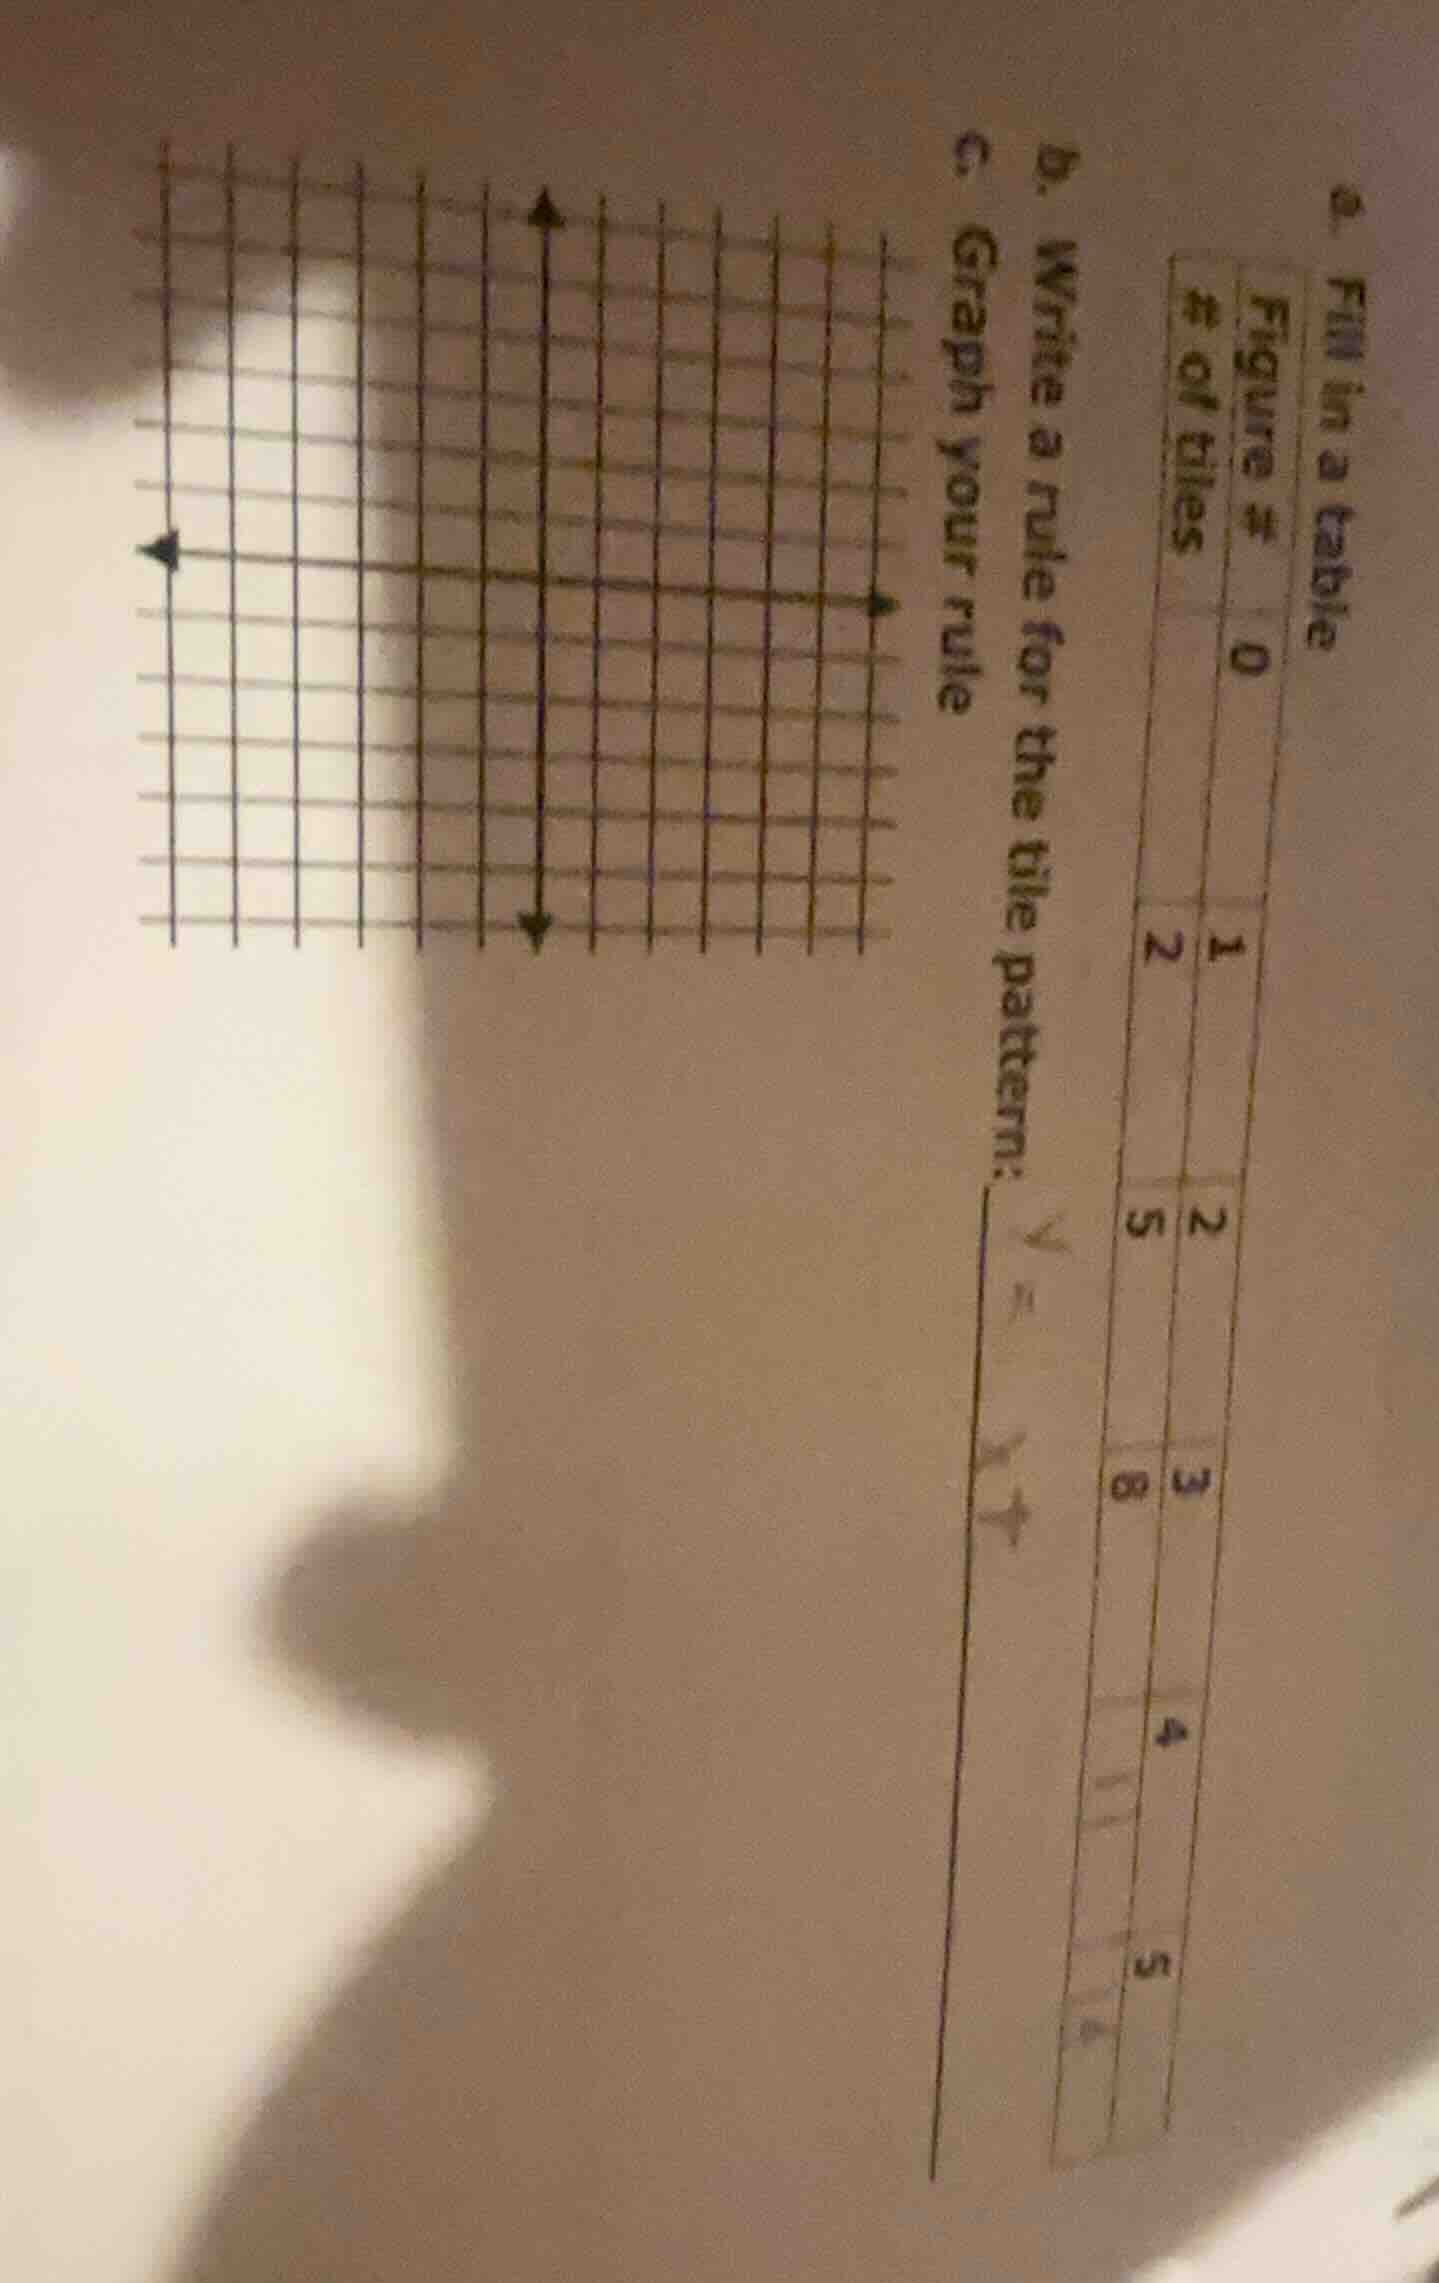
- fill in a table
figure #\t# of tiles
0\t
1\t2
2\t5
3\t8
4\t
5\t
b. write a rule for the tile pattern: ( y = )
c. graph your rule
Part a: Fill in the table
First, we analyze the pattern of the number of tiles with respect to the figure number.
Looking at the given data:
- For Figure 1, Number of tiles = 2
- For Figure 2, Number of tiles = 5
- For Figure 3, Number of tiles = 8
We can observe that the number of tiles is increasing by 3 each time. Let's verify:
- From Figure 1 to Figure 2: \(5 - 2 = 3\)
- From Figure 2 to Figure 3: \(8 - 5 = 3\)
So, the pattern is an arithmetic sequence with a common difference of 3. The general formula for the \(n\)-th term of an arithmetic sequence is \(a_n = a_1 + (n - 1)d\), where \(a_1\) is the first term and \(d\) is the common difference. Here, \(a_1 = 2\) and \(d = 3\), so \(a_n = 2 + (n - 1) \times 3 = 3n - 1\).
Now, let's find the number of tiles for Figure 0, Figure 4, and Figure 5:
- For Figure 0 (\(n = 0\)): \(a_0 = 3(0) - 1 = -1\)? Wait, that doesn't make sense. Wait, maybe the first term is when \(n = 1\), so let's re-examine. Wait, when Figure number is 1, tiles = 2; Figure 2, tiles = 5; Figure 3, tiles = 8. So the difference between figure number and tiles:
- Figure 1: 2 = 3(1) - 1
- Figure 2: 5 = 3(2) - 1
- Figure 3: 8 = 3(3) - 1
So the formula is \(y = 3x - 1\), where \(x\) is the figure number and \(y\) is the number of tiles.
Now, for Figure 0 (\(x = 0\)): \(y = 3(0) - 1 = -1\). But since we can't have negative tiles, maybe the pattern starts at Figure 1. Alternatively, maybe the initial term (Figure 0) is 2 - 3 = -1, but that's not practical. Maybe the table is supposed to start at Figure 1. Wait, the given table has Figure 0, 1, 2, 3, 4, 5.
Given:
- Figure 1: 2 tiles
- Figure 2: 5 tiles
- Figure 3: 8 tiles
So, let's compute for Figure 0: Let's see the difference between Figure 1 and Figure 0. If the common difference is 3, then Figure 0 should be 2 - 3 = -1. But that's odd. Maybe the problem has a typo, or maybe the pattern is different. Wait, maybe the first term is Figure 1: 2, Figure 2: 5, Figure 3: 8, so the sequence is 2, 5, 8, 11, 14, 17,... for Figure 1, 2, 3, 4, 5.
So:
- Figure 0: Let's assume the pattern is linear, so \(y = 3x - 1\). So for \(x = 0\), \(y = -1\). But that's not possible. Maybe the table is supposed to start at Figure 1. Alternatively, maybe the initial term (Figure 0) is 2, but that doesn't fit the pattern. Wait, maybe the pattern is \(y = 3x + 2\)? No, for \(x = 1\), 3(1) + 2 = 5, which is not 2. Wait, no. Wait, 2, 5, 8: the difference is 3, so the formula is \(y = 3x - 1\), where \(x\) is the figure number. So:
- Figure 0: \(y = 3(0) - 1 = -1\) (unrealistic, but mathematically)
- Figure 1: \(y = 3(1) - 1 = 2\) (correct)
- Figure 2: \(y = 3(2) - 1 = 5\) (correct)
- Figure 3: \(y = 3(3) - 1 = 8\) (correct)
- Figure 4: \(y = 3(4) - 1 = 11\)
- Figure 5: \(y = 3(5) - 1 = 14\)
So the table would be:
| Figure # | 0 | 1 | 2 | 3 | 4 | 5 |
|---|
But since having -1 tiles is odd, maybe the problem starts at Figure 1. Alternatively, maybe the pattern is \(y = 3x + 2\) for \(x \geq 1\), but that doesn't fit. Wait, no, 3(1) + 2 = 5, which is not 2. So the correct formula is \(y = 3x - 1\).
Part b: Write the rule
From the pattern, we see that the number of tiles \(y\) for figure number \(x\) follows the linear equation \(y = 3x - 1\). Let's verify:
- For \(x = 1\): \(y = 3(1) - 1 = 2\) (correct)
- For \(x = 2\): \(y = 3(2) - 1 = 5\) (correct)
- For \(x = 3\): \(y = 3(3) - 1 = 8\) (correct)
So the rule is \(y = 3x - 1\), where \(x\) is the figure number and \(y\) is the number of tiles.
Pa…

Snap & solve any problem in the app
Get step-by-step solutions on Sovi AI
Photo-based solutions with guided steps
Explore more problems and detailed explanations
Part a: Fill in the table
First, we analyze the pattern of the number of tiles with respect to the figure number.
Looking at the given data:
- For Figure 1, Number of tiles = 2
- For Figure 2, Number of tiles = 5
- For Figure 3, Number of tiles = 8
We can observe that the number of tiles is increasing by 3 each time. Let's verify:
- From Figure 1 to Figure 2: \(5 - 2 = 3\)
- From Figure 2 to Figure 3: \(8 - 5 = 3\)
So, the pattern is an arithmetic sequence with a common difference of 3. The general formula for the \(n\)-th term of an arithmetic sequence is \(a_n = a_1 + (n - 1)d\), where \(a_1\) is the first term and \(d\) is the common difference. Here, \(a_1 = 2\) and \(d = 3\), so \(a_n = 2 + (n - 1) \times 3 = 3n - 1\).
Now, let's find the number of tiles for Figure 0, Figure 4, and Figure 5:
- For Figure 0 (\(n = 0\)): \(a_0 = 3(0) - 1 = -1\)? Wait, that doesn't make sense. Wait, maybe the first term is when \(n = 1\), so let's re-examine. Wait, when Figure number is 1, tiles = 2; Figure 2, tiles = 5; Figure 3, tiles = 8. So the difference between figure number and tiles:
- Figure 1: 2 = 3(1) - 1
- Figure 2: 5 = 3(2) - 1
- Figure 3: 8 = 3(3) - 1
So the formula is \(y = 3x - 1\), where \(x\) is the figure number and \(y\) is the number of tiles.
Now, for Figure 0 (\(x = 0\)): \(y = 3(0) - 1 = -1\). But since we can't have negative tiles, maybe the pattern starts at Figure 1. Alternatively, maybe the initial term (Figure 0) is 2 - 3 = -1, but that's not practical. Maybe the table is supposed to start at Figure 1. Wait, the given table has Figure 0, 1, 2, 3, 4, 5.
Given:
- Figure 1: 2 tiles
- Figure 2: 5 tiles
- Figure 3: 8 tiles
So, let's compute for Figure 0: Let's see the difference between Figure 1 and Figure 0. If the common difference is 3, then Figure 0 should be 2 - 3 = -1. But that's odd. Maybe the problem has a typo, or maybe the pattern is different. Wait, maybe the first term is Figure 1: 2, Figure 2: 5, Figure 3: 8, so the sequence is 2, 5, 8, 11, 14, 17,... for Figure 1, 2, 3, 4, 5.
So:
- Figure 0: Let's assume the pattern is linear, so \(y = 3x - 1\). So for \(x = 0\), \(y = -1\). But that's not possible. Maybe the table is supposed to start at Figure 1. Alternatively, maybe the initial term (Figure 0) is 2, but that doesn't fit the pattern. Wait, maybe the pattern is \(y = 3x + 2\)? No, for \(x = 1\), 3(1) + 2 = 5, which is not 2. Wait, no. Wait, 2, 5, 8: the difference is 3, so the formula is \(y = 3x - 1\), where \(x\) is the figure number. So:
- Figure 0: \(y = 3(0) - 1 = -1\) (unrealistic, but mathematically)
- Figure 1: \(y = 3(1) - 1 = 2\) (correct)
- Figure 2: \(y = 3(2) - 1 = 5\) (correct)
- Figure 3: \(y = 3(3) - 1 = 8\) (correct)
- Figure 4: \(y = 3(4) - 1 = 11\)
- Figure 5: \(y = 3(5) - 1 = 14\)
So the table would be:
| Figure # | 0 | 1 | 2 | 3 | 4 | 5 |
|---|
But since having -1 tiles is odd, maybe the problem starts at Figure 1. Alternatively, maybe the pattern is \(y = 3x + 2\) for \(x \geq 1\), but that doesn't fit. Wait, no, 3(1) + 2 = 5, which is not 2. So the correct formula is \(y = 3x - 1\).
Part b: Write the rule
From the pattern, we see that the number of tiles \(y\) for figure number \(x\) follows the linear equation \(y = 3x - 1\). Let's verify:
- For \(x = 1\): \(y = 3(1) - 1 = 2\) (correct)
- For \(x = 2\): \(y = 3(2) - 1 = 5\) (correct)
- For \(x = 3\): \(y = 3(3) - 1 = 8\) (correct)
So the rule is \(y = 3x - 1\), where \(x\) is the figure number and \(y\) is the number of tiles.
Part c: Graph the rule
To graph \(y = 3x - 1\), we can plot the points from the table:
- For \(x = 0\), \(y = -1\) (point: (0, -1))
- For \(x = 1\), \(y = 2\) (point: (1, 2))
- For \(x = 2\), \(y = 5\) (point: (2, 5))
- For \(x = 3\), \(y = 8\) (point: (3, 8))
- For \(x = 4\), \(y = 11\) (point: (4, 11))
- For \(x = 5\), \(y = 14\) (point: (5, 14))
We can plot these points on a coordinate plane where the x-axis is the figure number and the y-axis is the number of tiles. The graph will be a straight line with a slope of 3 and a y-intercept of -1.
Final Answers
Part a: Filled Table
| Figure # | 0 | 1 | 2 | 3 | 4 | 5 |
|---|
(Note: The negative number for Figure 0 might indicate a theoretical start, but in practical terms, the pattern starts at Figure 1 with 2 tiles.)
Part b: Rule
The rule for the tile pattern is \(y = 3x - 1\), where \(x\) is the figure number and \(y\) is the number of tiles.
Part c: Graph
To graph the rule, plot the points \((0, -1)\), \((1, 2)\), \((2, 5)\), \((3, 8)\), \((4, 11)\), \((5, 14)\) on a coordinate plane and draw a straight line through them. The line will have a slope of 3 and a y-intercept of -1.