QUESTION IMAGE
Question
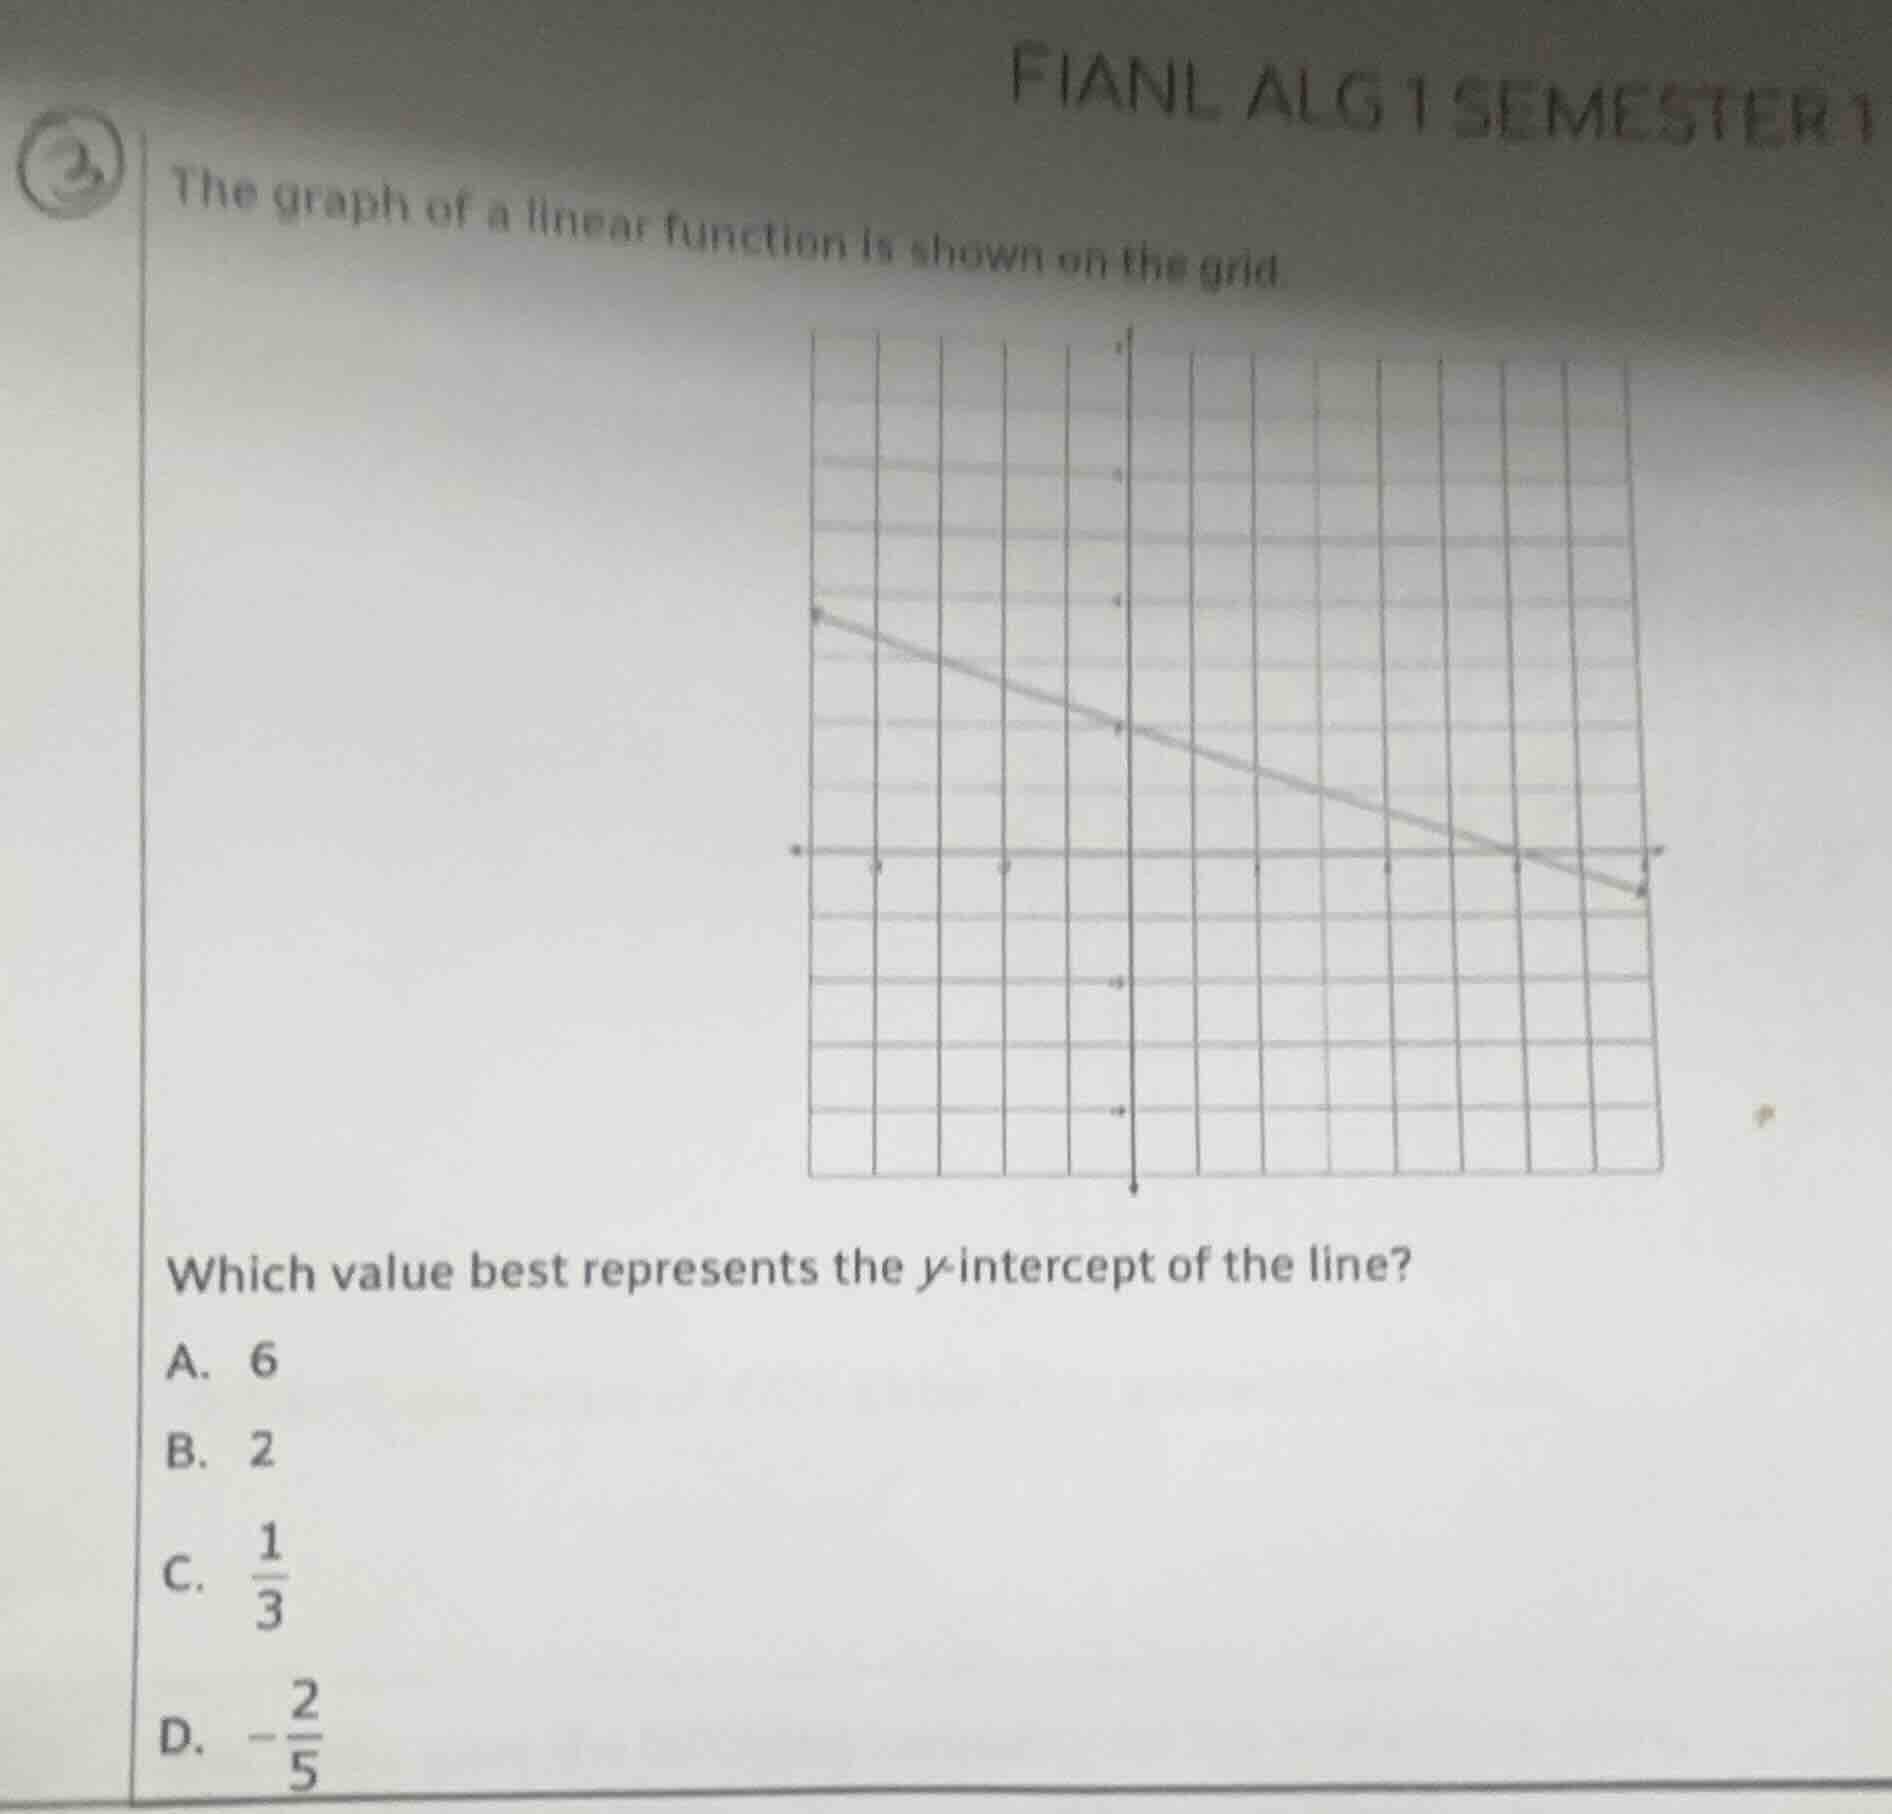
final alg 1 semester 1
- the graph of a linear function is shown on the grid.
which value best represents the y-intercept of the line?
a. 6
b. 2
c. \\(\frac{1}{3}\\)
d. \\(-\frac{2}{5}\\)
Step1: Identify two points on line
Choose points $(-5, 4)$ and $(5, 0)$ from the graph.
Step2: Calculate slope $m$
Use slope formula: $m=\frac{y_2-y_1}{x_2-x_1}$
$m=\frac{0-4}{5-(-5)}=\frac{-4}{10}=-\frac{2}{5}$
Step3: Find y-intercept $b$
Use $y=mx+b$, substitute $(5,0)$ and $m$:
$0=-\frac{2}{5}(5)+b$
$0=-2+b$
$b=2$

Snap & solve any problem in the app
Get step-by-step solutions on Sovi AI
Photo-based solutions with guided steps
Explore more problems and detailed explanations
B. 2