QUESTION IMAGE
Question
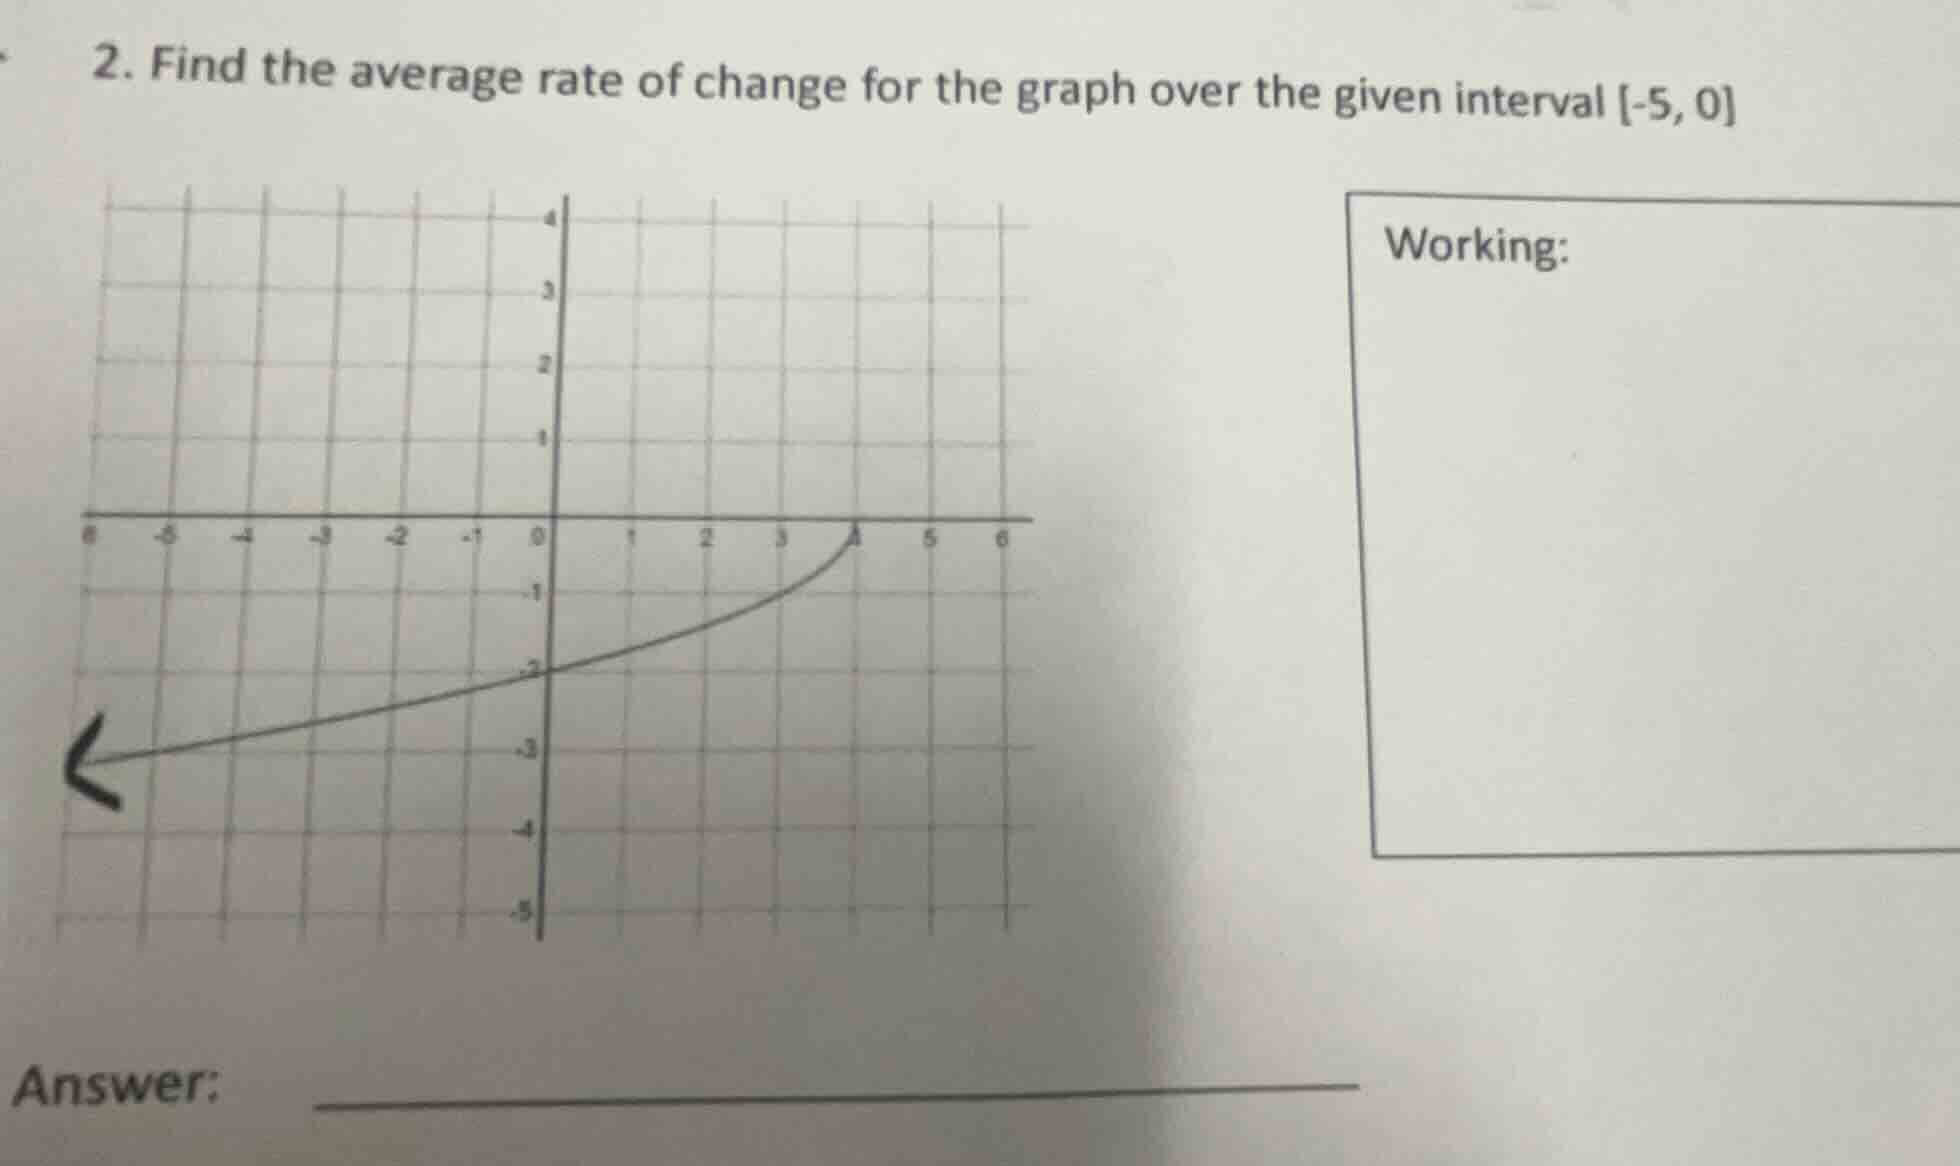
- find the average rate of change for the graph over the given interval -5, 0
working:
answer:
Step1: Recall the formula for average rate of change
The average rate of change of a function \( y = f(x) \) over the interval \([a, b]\) is given by \( \frac{f(b)-f(a)}{b - a} \). Here, \( a=-5 \) and \( b = 0 \).
Step2: Find \( f(-5) \) and \( f(0) \) from the graph
From the graph, when \( x=-5 \), we need to find the corresponding \( y \)-value. Looking at the line, when \( x = 0 \), \( y=-2 \) (since the graph crosses the \( y \)-axis at \( (0, - 2) \)). When \( x=-5 \), let's assume the \( y \)-value (by looking at the line's slope and intercept). Wait, actually, let's re - examine the graph. The line passes through \( (0,-2) \) and let's find the point at \( x = - 5 \). Let's see the slope - intercept form \( y=mx + c \), where \( c=-2 \) (since at \( x = 0 \), \( y=-2 \)). Let's take another point, say, if we look at the line, when \( x=-5 \), what's \( y \)? Wait, maybe we can calculate the slope between \( x=-5 \) and \( x = 0 \). Wait, actually, from the graph, when \( x = 0 \), \( y=-2 \), and when \( x=-5 \), let's see the line. Let's count the grid. The line goes from \( (0,-2) \) and for \( x=-5 \), let's see the change. Wait, maybe the two points are \( (-5,y_1) \) and \( (0,y_2) \). From the graph, when \( x = 0 \), \( y=-2 \), and when \( x=-5 \), let's assume the \( y \)-value. Wait, maybe I made a mistake. Wait, the line: let's see, the graph is a straight line? Wait, the left part is a straight line? Wait, the graph has a straight line from the left (with the arrow) passing through \( (0,-2) \). Let's find the \( y \)-value at \( x=-5 \). Let's calculate the slope. Wait, the average rate of change formula is \( \frac{f(0)-f(-5)}{0-(-5)}=\frac{f(0)-f(-5)}{5} \). From the graph, when \( x = 0 \), \( f(0)=-2 \). When \( x=-5 \), let's look at the line. Let's see, the line at \( x=-5 \): let's count the vertical and horizontal distances. Wait, maybe the line passes through \( (-5,-3) \)? Wait, no, let's re - check. Wait, the line: when \( x = 0 \), \( y=-2 \). Let's see the slope. Wait, maybe the two points are \( (-5,-3) \) and \( (0,-2) \)? No, wait, let's do it properly. Wait, the formula is \( \frac{f(0)-f(-5)}{0 - (-5)}=\frac{f(0)-f(-5)}{5} \). From the graph, when \( x = 0 \), \( f(0)=-2 \). When \( x=-5 \), let's find \( f(-5) \). Let's see the line: if we move from \( x=-5 \) to \( x = 0 \) (a change of \( \Delta x=5 \)), what's the change in \( y \)? Wait, maybe the \( y \)-value at \( x=-5 \) is \( - 3 \)? Wait, no, let's look at the graph again. Wait, the line is going from the left (with the arrow) and intersects the \( y \)-axis at \( (0,-2) \). Let's assume that at \( x=-5 \), the \( y \)-value is \( - 3 \)? Wait, no, maybe I made a mistake. Wait, let's use the two points: \( (x_1,y_1)=(-5,y_1) \) and \( (x_2,y_2)=(0,-2) \). The average rate of change is \( \frac{y_2 - y_1}{x_2 - x_1}=\frac{-2 - y_1}{0-(-5)}=\frac{-2 - y_1}{5} \). Wait, maybe the line is such that when \( x=-5 \), \( y=-3 \)? Then \( \frac{-2-(-3)}{5}=\frac{1}{5}=0.2 \)? No, that doesn't seem right. Wait, maybe the \( y \)-value at \( x=-5 \) is \( - 3 \)? Wait, no, let's look at the graph again. Wait, the grid: each square is 1 unit. The line passes through \( (0,-2) \) and let's see the point at \( x=-5 \). Let's count the slope. From \( x=-5 \) to \( x = 0 \) (a run of 5), the rise: from \( y=-3 \) to \( y=-2 \) is a rise of 1. So \( f(-5)=-3 \) and \( f(0)=-2 \). Then the average rate of change is \( \frac{f(0)-f(-5)}{0-(-5)}=\frac{-2-(-3)}{5}=\frac{1}{5}=0.2 \)? Wait, no, wait, maybe I got the points wrong. Wait, maybe the \(…

Snap & solve any problem in the app
Get step-by-step solutions on Sovi AI
Photo-based solutions with guided steps
Explore more problems and detailed explanations
\( \frac{1}{5} \) (or \( 0.2 \))