QUESTION IMAGE
Question
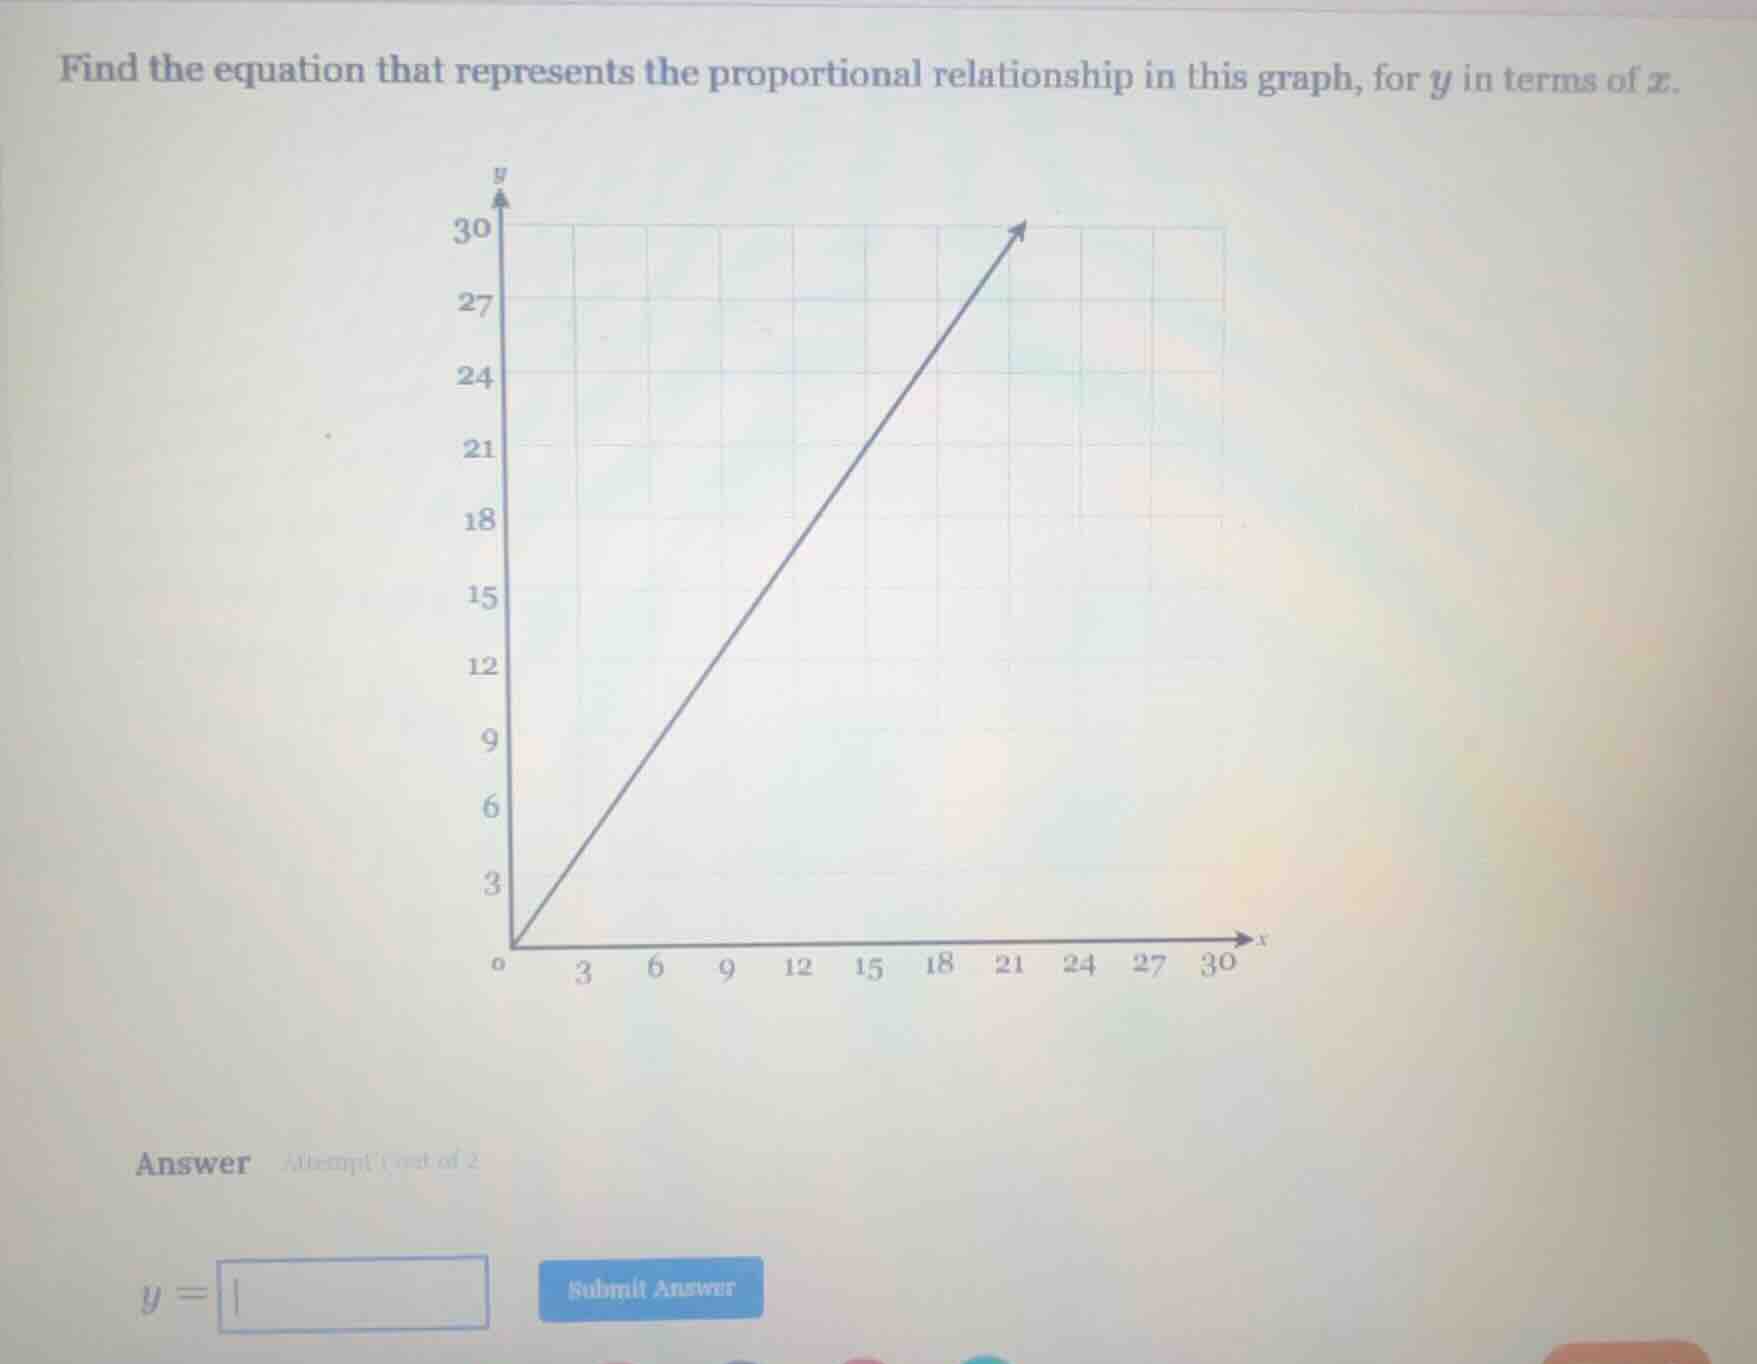
find the equation that represents the proportional relationship in this graph, for ( y ) in terms of ( x ).
Step1: Recall proportional relationship formula
For a proportional relationship, the equation is \( y = kx \), where \( k \) is the constant of proportionality (slope).
Step2: Find two points on the line
From the graph, we can see that when \( x = 3 \), \( y = 9 \) (or other points like \( x = 6, y = 18 \), etc.). Let's use \( (x_1,y_1)=(3,9) \).
Step3: Calculate the slope \( k \)
The slope \( k=\frac{y}{x} \). Substituting \( x = 3 \) and \( y = 9 \), we get \( k=\frac{9}{3}=3 \)? Wait, no, wait. Wait, looking at the graph again, when \( x = 3 \), \( y = 9 \)? Wait, no, the grid: let's check the coordinates. Wait, the y-axis: 3,6,9,12,... and x-axis: 3,6,9,... Wait, when x=3, y=9? Wait, no, maybe I misread. Wait, the line passes through (3,9)? Wait, no, let's take (6, 18). Then \( k=\frac{18}{6}=3 \)? Wait, no, wait the graph: when x=3, y=9? Wait, no, the y-axis at x=3: let's see the grid. Each square is 3 units? Wait, x-axis: 0,3,6,9,... y-axis: 0,3,6,9,... Wait, no, the line goes from (0,0) to, say, (3,9)? Wait, no, 3 on x, 9 on y? Then slope is 9/3=3? Wait, but let's check another point. When x=6, y=18. 18/6=3. So the slope k is 3? Wait, no, wait the graph: the y-axis has 3,6,9,12,15,18,21,24,27,30. The x-axis has 0,3,6,9,12,15,18,21,24,27,30. So when x=3, y=9? Wait, no, that can't be. Wait, maybe the grid is 1 unit per square? Wait, no, the labels are 3,6,9,... So each square is 3 units? Wait, no, the x-axis label at 3, 6, etc., so each tick is 3 units. But the line: from (0,0) to (3,9)? Wait, no, 3 on x (which is 3 units) and 9 on y (9 units). Then slope is 9/3=3. So the equation is \( y = 3x \)? Wait, but let's check x=6, y=18: 36=18, correct. x=9, y=27: 39=27, correct. So the constant of proportionality k is 3. Wait, but wait, maybe I made a mistake. Wait, the graph: when x=1, y=3? No, the x-axis ticks are at 3,6,9,... So each tick is 3 units. So the point (3,9) is (x=3, y=9). So slope is 9/3=3. So the equation is \( y = 3x \)? Wait, but let's check the original graph. Wait, the user's graph: the y-axis has 3,6,9,... and x-axis has 0,3,6,... So the line passes through (3,9), (6,18), etc. So the slope is 9/3=3. So the equation is \( y = 3x \)? Wait, no, wait, maybe I misread the graph. Wait, maybe the x-axis is 1 unit per square, not 3. Wait, the x-axis labels are 0,3,6,9,... so each square is 3 units. So x=3 is 3 units, y=9 is 9 units. So slope is 9/3=3. So the equation is \( y = 3x \). Wait, but let's check the initial problem. Wait, the graph: when x=3, y=9? So the slope is 9/3=3. So the equation is \( y = 3x \).
Wait, no, wait, maybe I made a mistake. Let's take x=1, y=3? No, the x-axis ticks are at 3, so x=3 is 3 units. So the point (3,9) is (x=3, y=9). So slope is 9/3=3. So the equation is \( y = 3x \).

Snap & solve any problem in the app
Get step-by-step solutions on Sovi AI
Photo-based solutions with guided steps
Explore more problems and detailed explanations
\( y = 3x \)