QUESTION IMAGE
Question
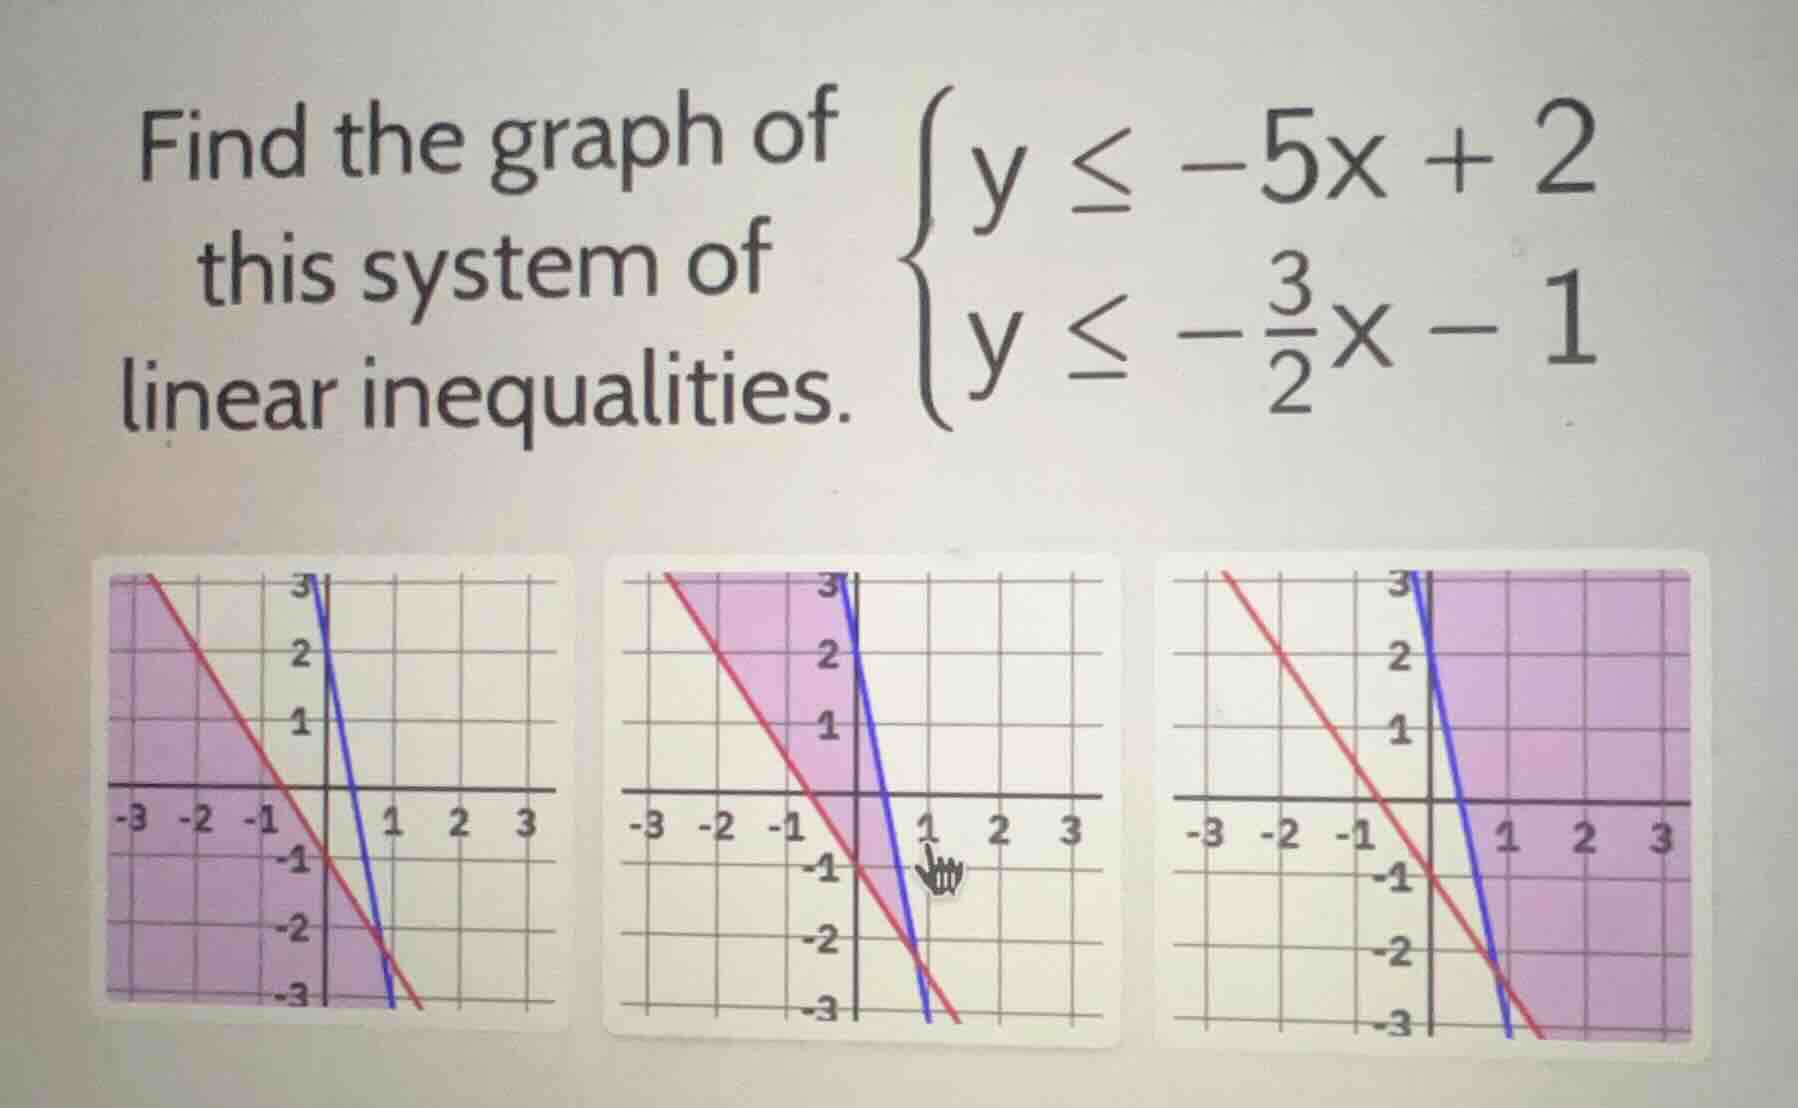
find the graph of this system of linear inequalities. \\(\
\\)
Step1: Analyze the first inequality \( y \leq -5x + 2 \)
The boundary line is \( y = -5x + 2 \), which has a slope of \(-5\) and a y - intercept of \( 2 \). Since the inequality is \( \leq \), the line is solid, and we shade below the line.
Step2: Analyze the second inequality \( y \leq -\frac{3}{2}x - 1 \)
The boundary line is \( y=-\frac{3}{2}x - 1 \), with a slope of \(-\frac{3}{2}\) and a y - intercept of \(-1\). The inequality is \( \leq \), so the line is solid, and we shade below the line.
Step3: Determine the intersection of the shaded regions
The solution to the system of inequalities is the region that is shaded for both inequalities. For \( y \leq - 5x+2 \) (blue line) and \( y\leq-\frac{3}{2}x - 1 \) (red line), we need to find where the "below both lines" regions overlap.
- For the line \( y=-5x + 2 \), when \( x = 0 \), \( y = 2 \); when \( y=0\), \( x=\frac{2}{5}=0.4 \)
- For the line \( y =-\frac{3}{2}x-1 \), when \( x = 0 \), \( y=-1 \); when \( y = 0\), \( x=-\frac{2}{3}\approx - 0.67\)
The first graph (the left - most one) shows the region that is below both the line \( y=-5x + 2\) (blue) and \( y =-\frac{3}{2}x-1\) (red) as the overlapping shaded area. The second graph has a shaded region that is not below both lines, and the third graph also does not represent the overlapping region of "below both lines" correctly.

Snap & solve any problem in the app
Get step-by-step solutions on Sovi AI
Photo-based solutions with guided steps
Explore more problems and detailed explanations
The left - most graph (the first graph among the three given graphs) is the graph of the system of linear inequalities.