QUESTION IMAGE
Question
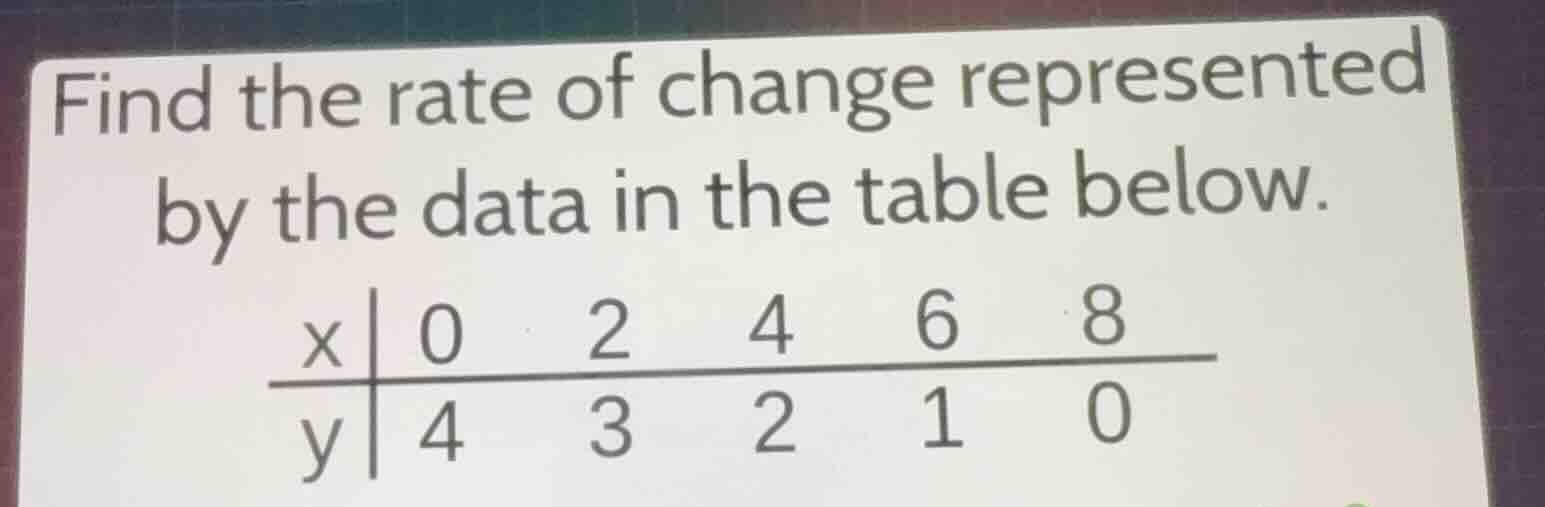
find the rate of change represented by the data in the table below. \\(\
$$\begin{array}{c|ccccc}x & 0 & 2 & 4 & 6 & 8 \\\\ \\hline y & 4 & 3 & 2 & 1 & 0\\end{array}$$
\\)
Step1: Recall rate of change formula
The rate of change between two points $(x_1,y_1)$ and $(x_2,y_2)$ is $\frac{y_2 - y_1}{x_2 - x_1}$.
Step2: Pick two data points
Choose $(x_1,y_1)=(0,4)$ and $(x_2,y_2)=(2,3)$.
Step3: Calculate rate of change
$\frac{3 - 4}{2 - 0} = \frac{-1}{2}$
Step4: Verify with another pair
Use $(x_1,y_1)=(2,3)$ and $(x_2,y_2)=(4,2)$:
$\frac{2 - 3}{4 - 2} = \frac{-1}{2}$

Snap & solve any problem in the app
Get step-by-step solutions on Sovi AI
Photo-based solutions with guided steps
Explore more problems and detailed explanations
$\boldsymbol{-\frac{1}{2}}$