QUESTION IMAGE
Question
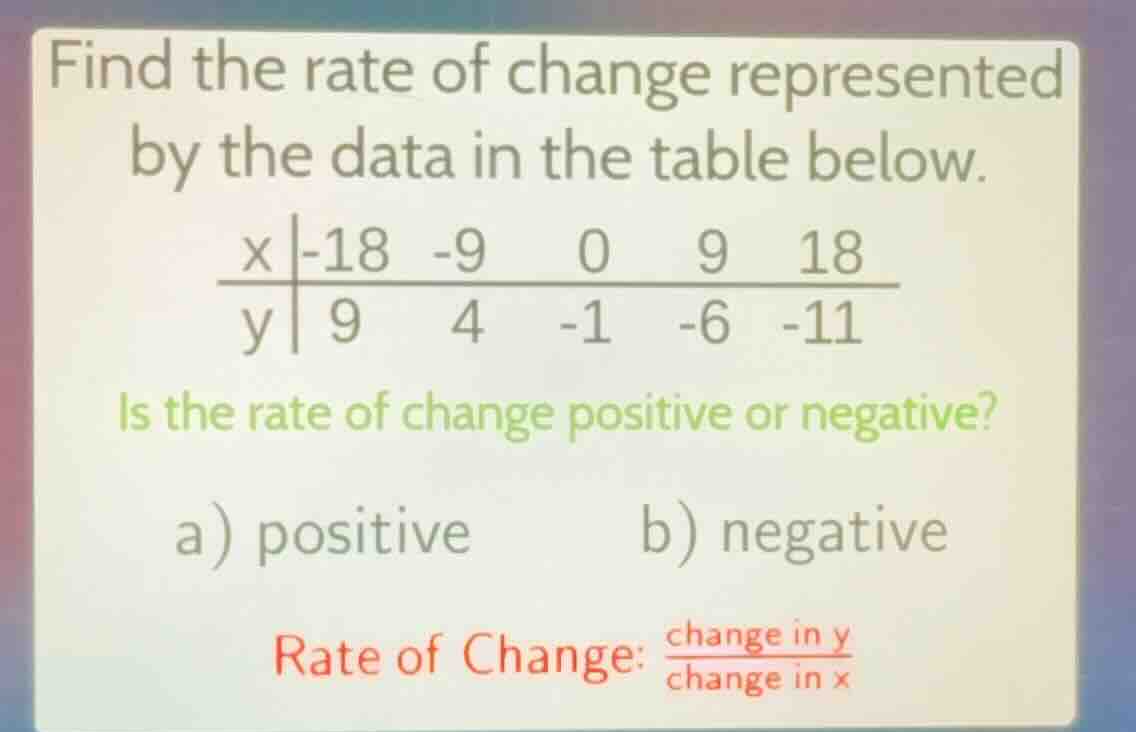
find the rate of change represented by the data in the table below.
x|-18 -9 0 9 18
y| 9 4 -1 -6 -11
is the rate of change positive or negative?
a) positive b) negative
rate of change: \\(\frac{\text{change in } y}{\text{change in } x}\\)
Step1: Calculate change in x
Take two consecutive x-values: $\Delta x = -9 - (-18) = 9$
Step2: Calculate change in y
Take corresponding y-values: $\Delta y = 4 - 9 = -5$
Step3: Compute rate of change
Use formula: $\text{Rate of Change} = \frac{\Delta y}{\Delta x} = \frac{-5}{9}$
Step4: Sign of rate of change
The value $\frac{-5}{9}$ is less than 0, so it is negative.

Snap & solve any problem in the app
Get step-by-step solutions on Sovi AI
Photo-based solutions with guided steps
Explore more problems and detailed explanations
b) negative
Rate of Change: $\boldsymbol{\frac{-5}{9}}$