QUESTION IMAGE
Question
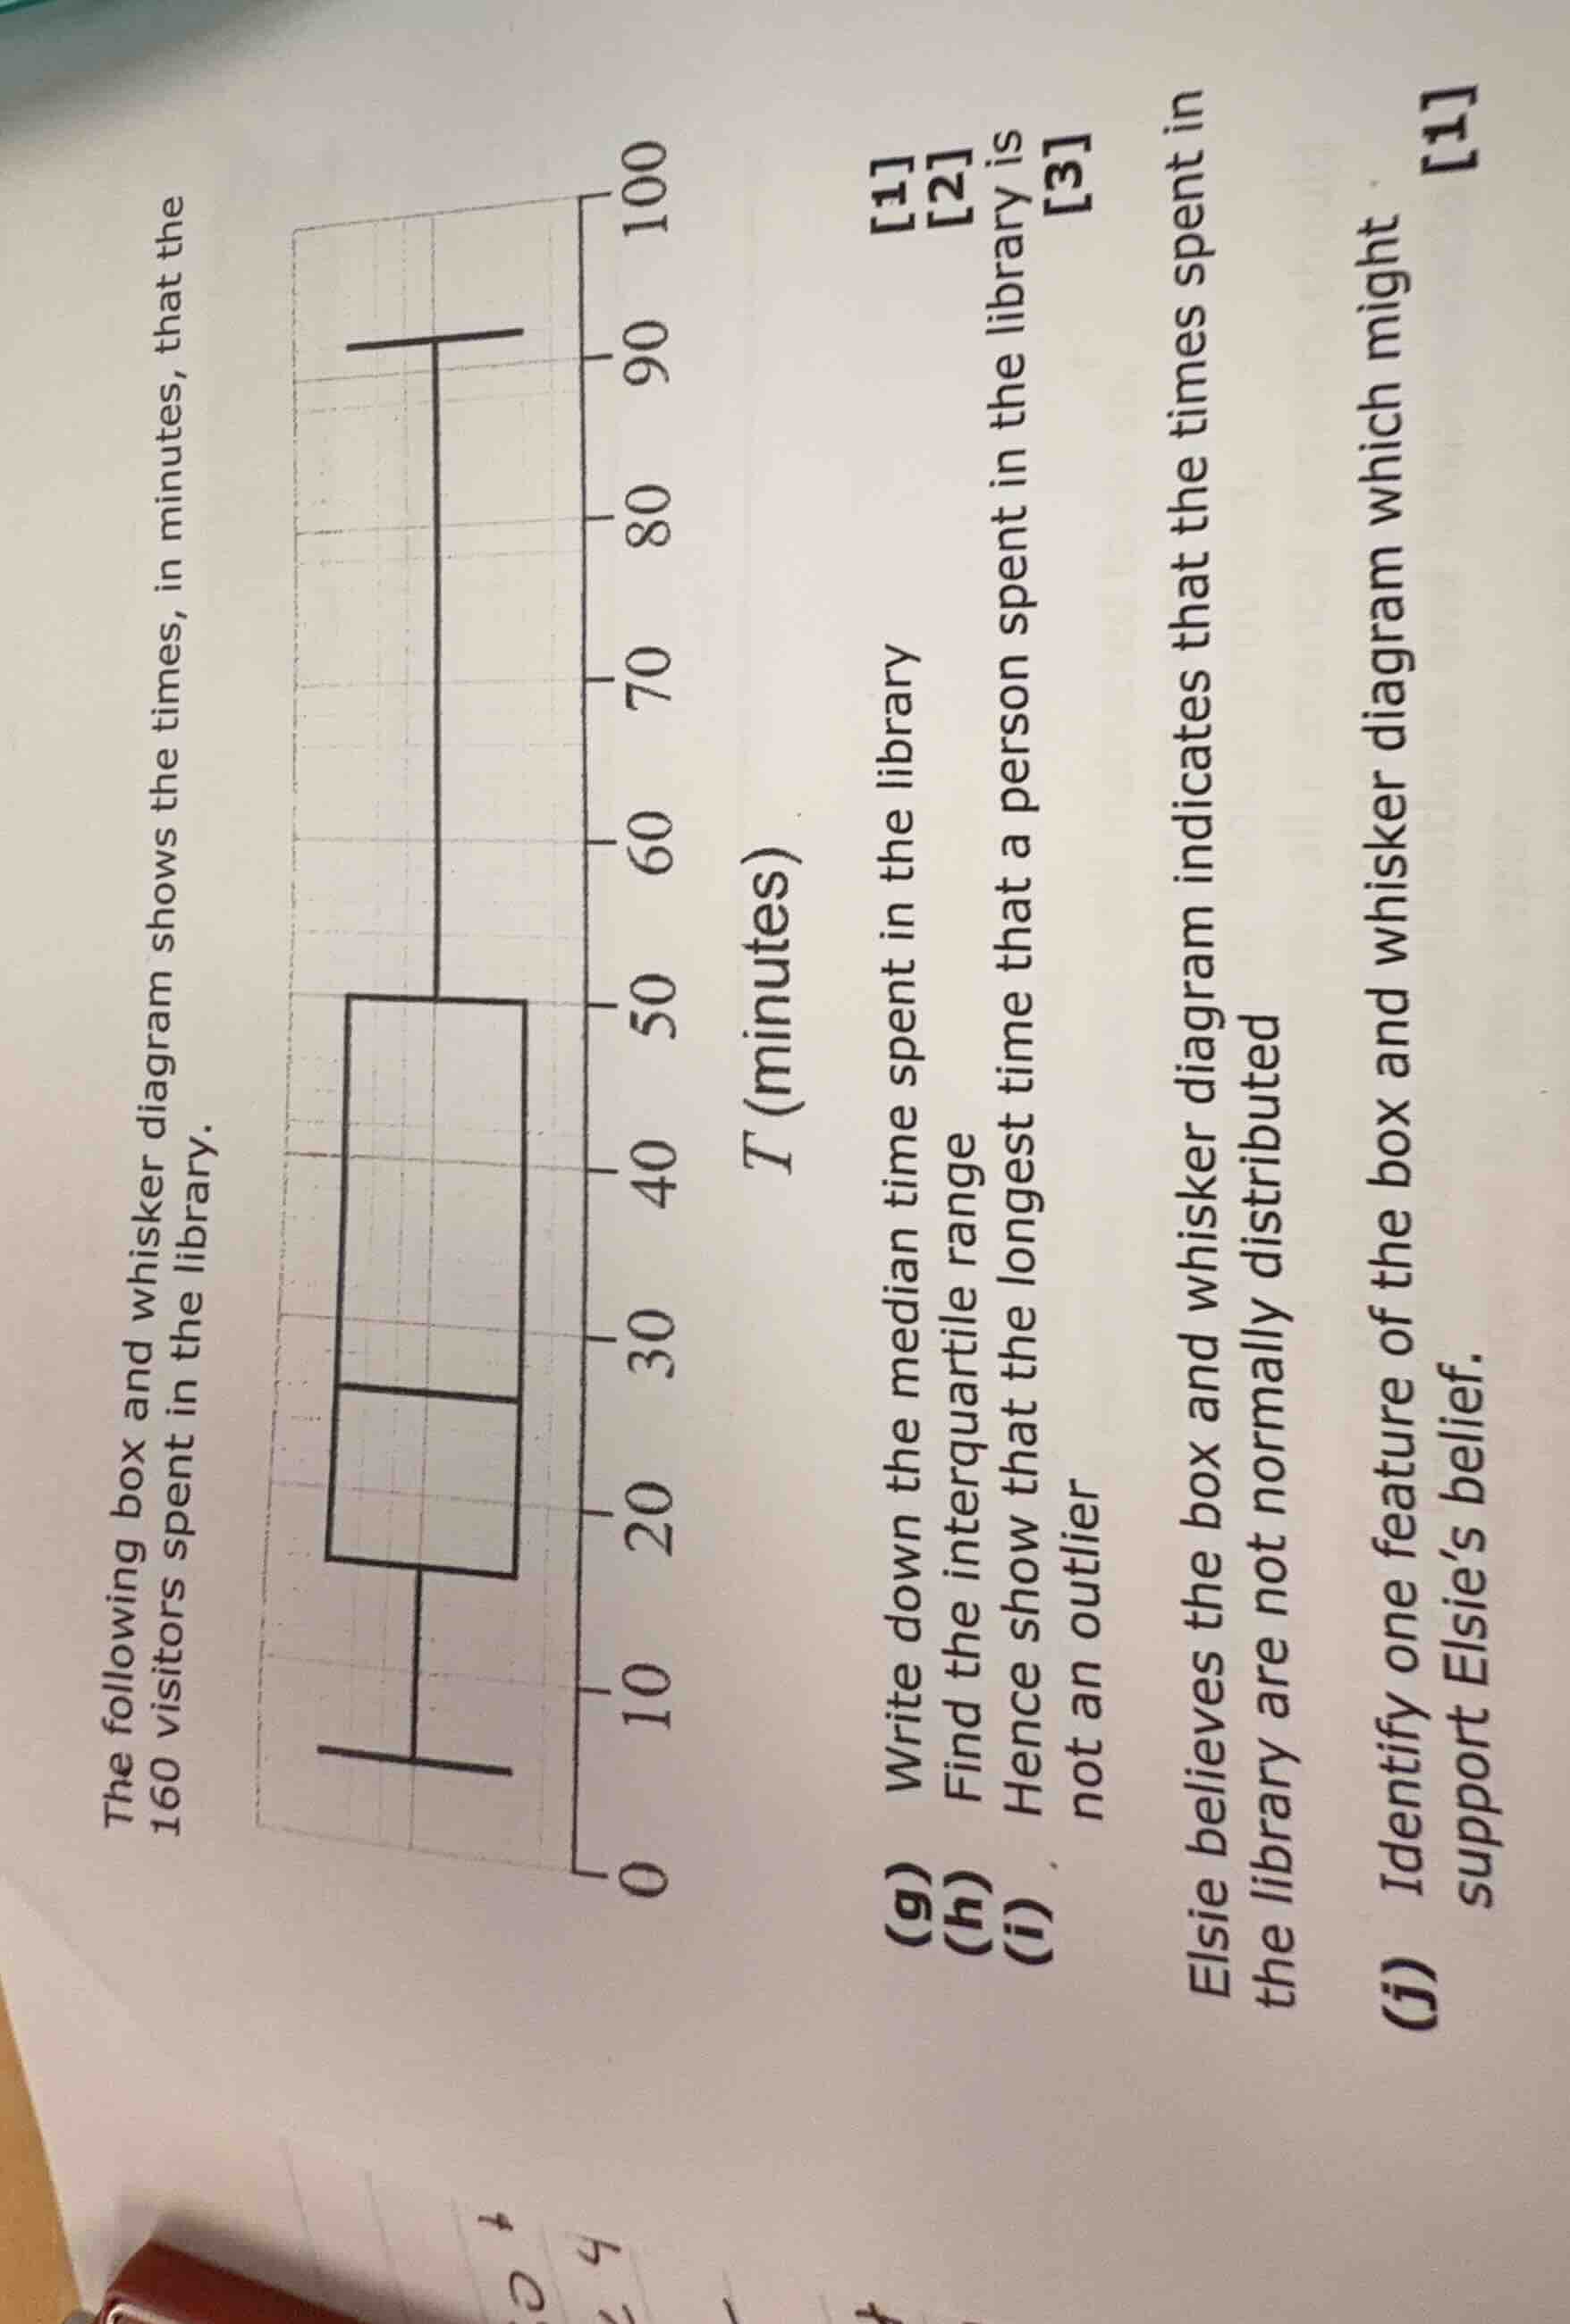
the following box and whisker diagram shows the times, in minutes, that the 160 visitors spent in the library.
(g) write down the median time spent in the library 1
(h) find the interquartile range 2
(i) hence show that the longest time that a person spent in the library is not an outlier 3
elsie believes the box and whisker diagram indicates that the times spent in the library are not normally distributed
(j) identify one feature of the box and whisker diagram which might support elsie’s belief. 1
Step1: Identify median from box plot
The median is the line inside the box, which aligns with 30 minutes.
Step2: Identify quartiles for interquartile range
Q1 (lower quartile) = 15 minutes, Q3 (upper quartile) = 50 minutes.
Interquartile range (IQR) = $Q3 - Q1$
$\text{IQR} = 50 - 15 = 35$ minutes
Step3: Calculate outlier threshold
Upper outlier limit = $Q3 + 1.5 \times \text{IQR}$
$\text{Upper limit} = 50 + 1.5 \times 35 = 50 + 52.5 = 102.5$ minutes
The longest time is 90 minutes, which is less than 102.5, so it is not an outlier.
Step4: Identify non-normal distribution feature
For a normal distribution, the median should be centered in the box, and whiskers should be symmetric. Here, the median is closer to Q1, and the upper whisker is much longer than the lower whisker, showing skewness.

Snap & solve any problem in the app
Get step-by-step solutions on Sovi AI
Photo-based solutions with guided steps
Explore more problems and detailed explanations
(g) 30 minutes
(h) 35 minutes
(i) The upper outlier limit is $50 + 1.5\times35 = 102.5$ minutes. Since 90 < 102.5, the longest time is not an outlier.
(j) The distribution is positively skewed (the median is closer to the lower quartile, or the upper whisker is much longer than the lower whisker), which means it is not symmetric as a normal distribution would be.