QUESTION IMAGE
Question
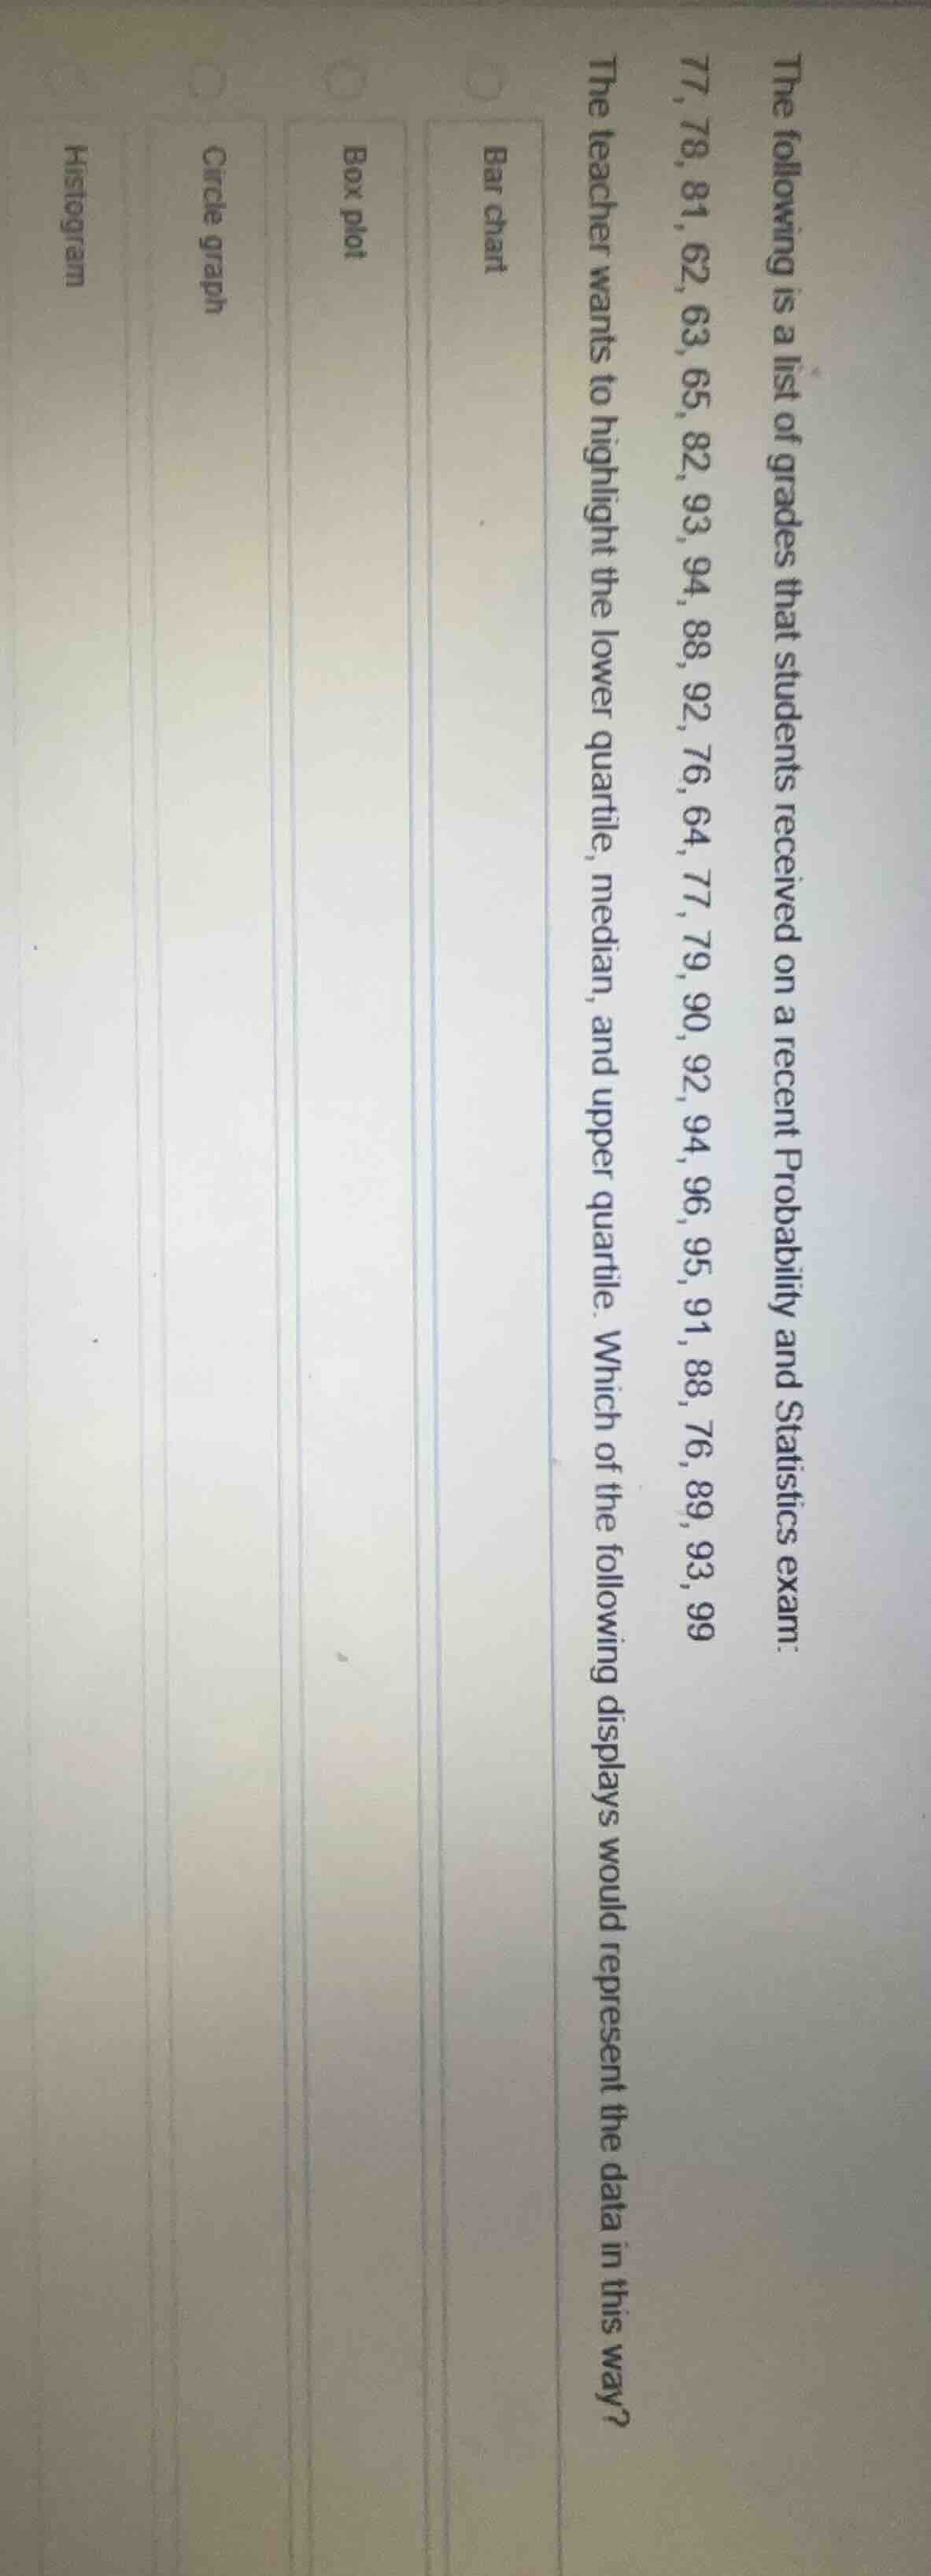
the following is a list of grades that students received on a recent probability and statistics exam: 77, 78, 81, 62, 63, 65, 82, 93, 94, 88, 92, 76, 64, 77, 79, 90, 92, 94, 96, 95, 91, 88, 76, 89, 93, 99 the teacher wants to highlight the lower quartile, median, and upper quartile. which of the following displays would represent the data in this way? bar chart box plot circle graph histogram
A box plot (box-and-whisker plot) is specifically designed to visually display the lower quartile, median, and upper quartile of a dataset, along with the minimum and maximum values. Bar charts compare discrete categories, circle graphs show proportions of a whole, and histograms display frequency distributions of data ranges, none of which directly highlight quartiles and the median as their primary function.

Snap & solve any problem in the app
Get step-by-step solutions on Sovi AI
Photo-based solutions with guided steps
Explore more problems and detailed explanations
Box plot