QUESTION IMAGE
Question
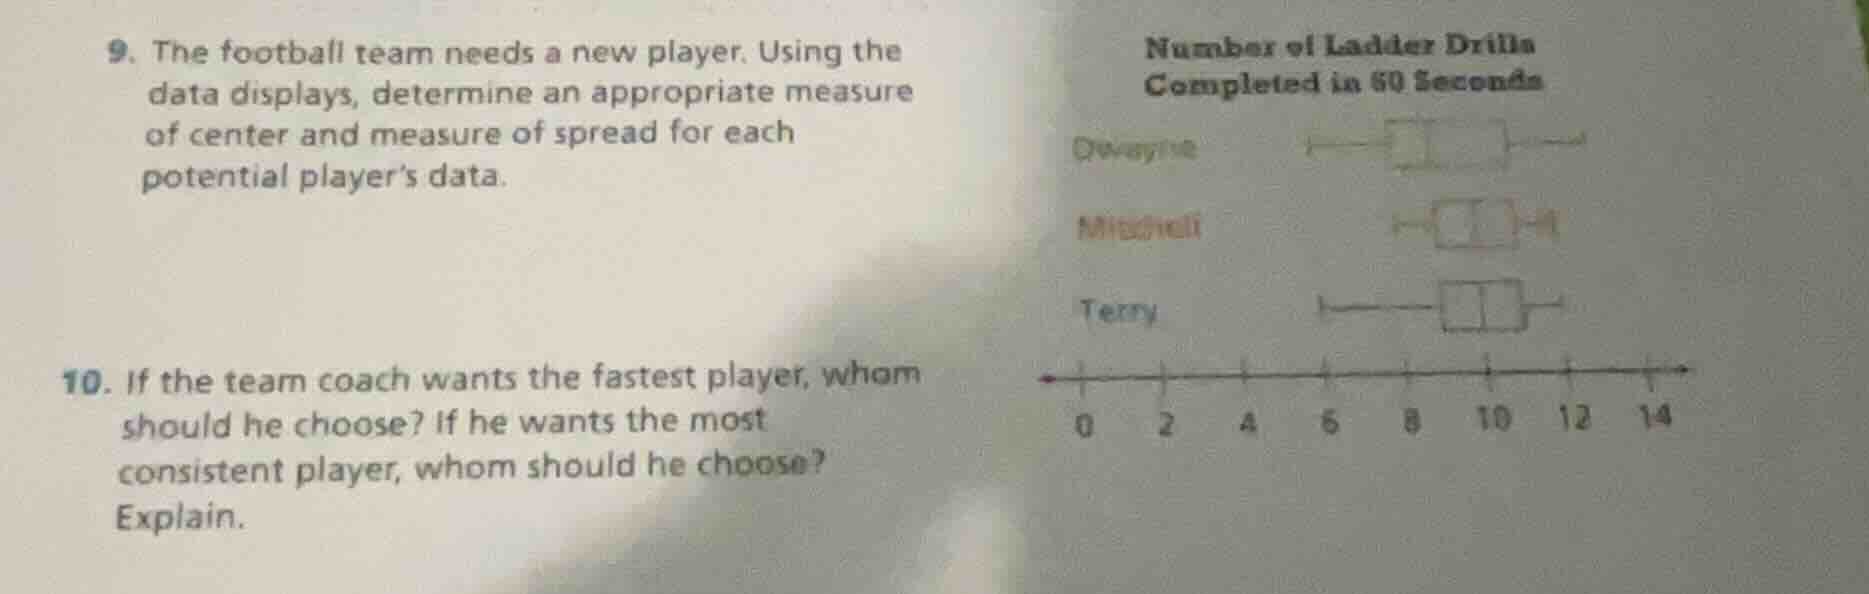
- the football team needs a new player. using the data displays, determine an appropriate measure of center and measure of spread for each potential player’s data.
- if the team coach wants the fastest player, whom should he choose? if he wants the most consistent player, whom should he choose? explain.
Step1: Analyze fastest player metric
Faster players complete more ladder drills in 60 seconds, so we look for the player with the highest median/typical value.
- Dwayne: median ≈ 9
- Mitchell: median ≈ 7
- Terry: median ≈ 10
Step2: Analyze most consistent player metric
Consistency means the smallest spread (interquartile range, IQR) of data.
- Dwayne: IQR ≈ 11 - 7 = 4
- Mitchell: IQR ≈ 8 - 5 = 3
- Terry: IQR ≈ 11 - 9 = 2
Wait, correction: Reassess spread visually:
Mitchell's data is tightly clustered (smallest range/IQR), Terry's spread is larger than Mitchell's, Dwayne's is largest. Wait no, recheck:
Wait, fastest is highest number of drills: Terry has highest median (10), so Terry is fastest.
Most consistent: smallest spread (least variation). Mitchell's box plot is the narrowest, so least variation.

Snap & solve any problem in the app
Get step-by-step solutions on Sovi AI
Photo-based solutions with guided steps
Explore more problems and detailed explanations
- For the fastest player: The coach should choose Terry, because Terry has the highest median number of ladder drills completed in 60 seconds, meaning he typically finishes more drills (is faster) than the other players.
- For the most consistent player: The coach should choose Mitchell, because Mitchell's box plot has the smallest spread (narrowest interquartile range), indicating his number of completed drills has the least variation, so he is the most consistent.