QUESTION IMAGE
Question
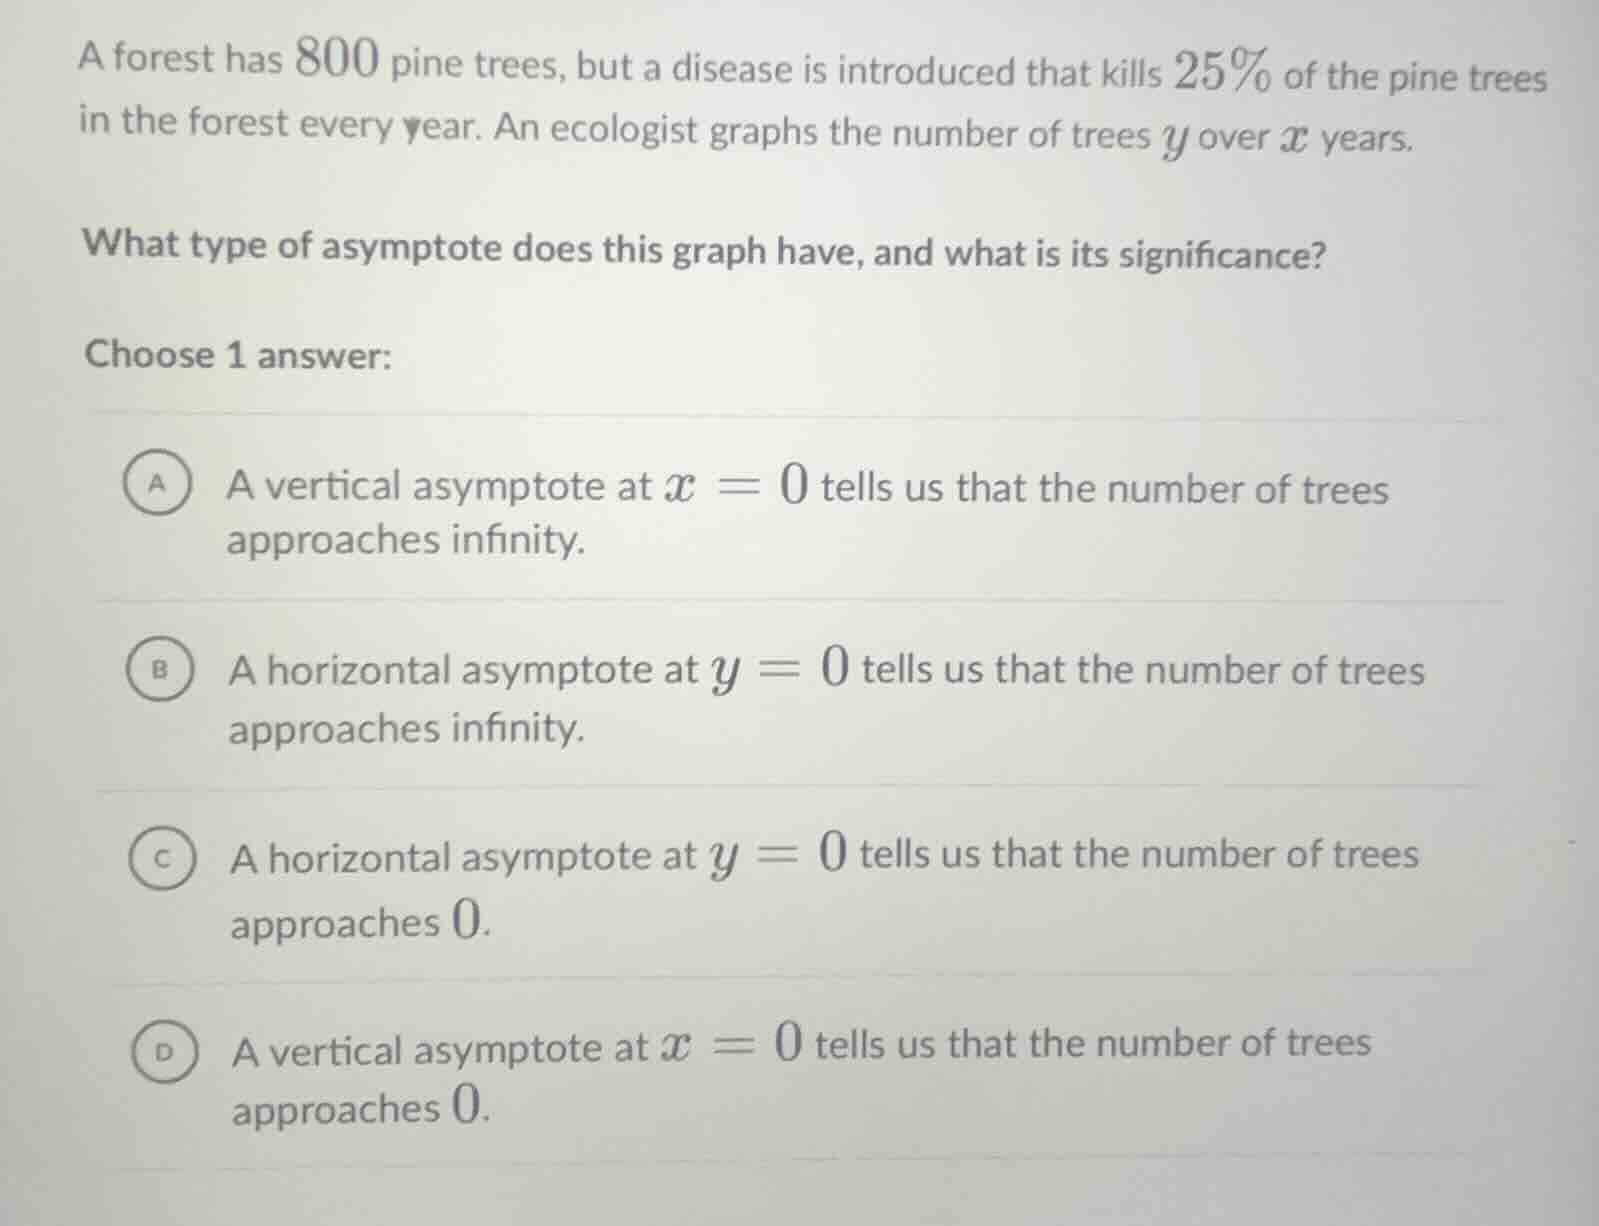
a forest has 800 pine trees, but a disease is introduced that kills 25% of the pine trees in the forest every year. an ecologist graphs the number of trees y over x years. what type of asymptote does this graph have, and what is its significance? choose 1 answer: a a vertical asymptote at x = 0 tells us that the number of trees approaches infinity. b a horizontal asymptote at y = 0 tells us that the number of trees approaches infinity. c a horizontal asymptote at y = 0 tells us that the number of trees approaches 0. d a vertical asymptote at x = 0 tells us that the number of trees approaches 0.
Step1: Define decay function
The number of trees follows an exponential decay model: $y = 800(1-0.25)^x = 800(0.75)^x$
Step2: Analyze asymptote behavior
As $x \to +\infty$, $0.75^x \to 0$, so $y \to 0$. This is a horizontal asymptote.
Step3: Match to correct option
The asymptote $y=0$ means the tree count approaches 0.

Snap & solve any problem in the app
Get step-by-step solutions on Sovi AI
Photo-based solutions with guided steps
Explore more problems and detailed explanations
C. A horizontal asymptote at $y = 0$ tells us that the number of trees approaches 0.