QUESTION IMAGE
Question
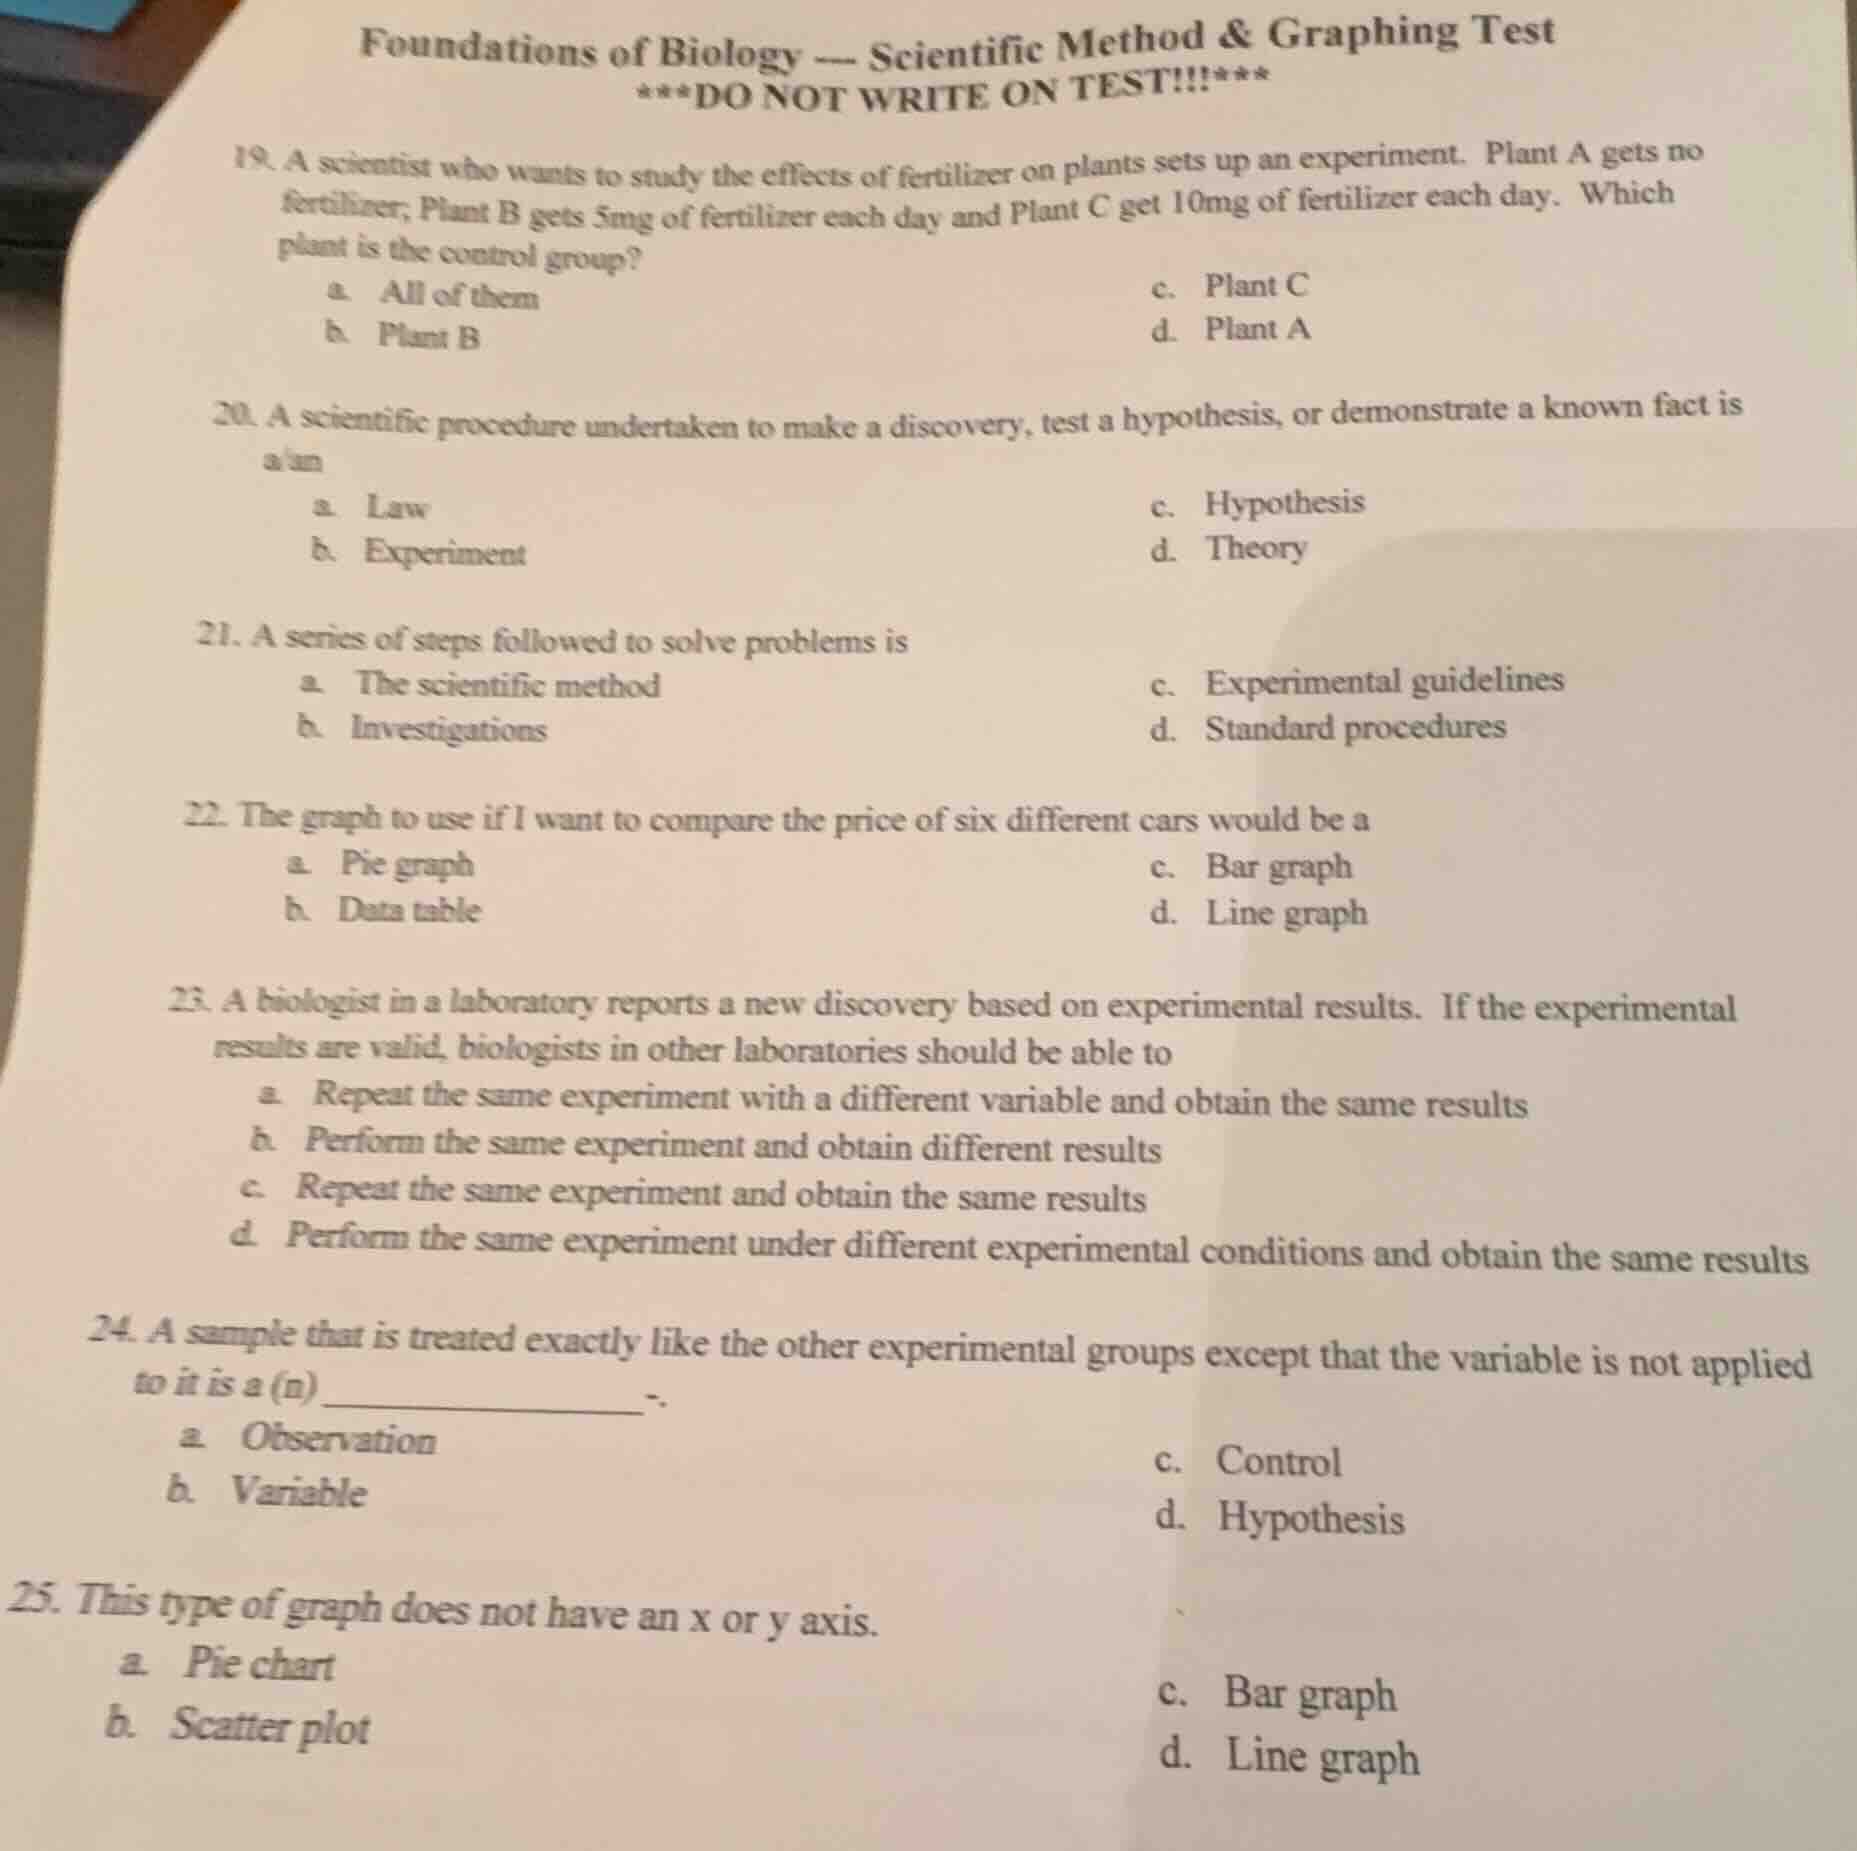
foundations of biology --- scientific method & graphing test
do not write on test!!!
- a scientist who wants to study the effects of fertilizer on plants sets up an experiment. plant a gets no fertilizer; plant b gets 5mg of fertilizer each day and plant c get 10mg of fertilizer each day. which plant is the control group?
a. all of them
c. plant c
b. plant b
d. plant a
- a scientific procedure undertaken to make a discovery, test a hypothesis, or demonstrate a known fact is a/an
a. law
c. hypothesis
b. experiment
d. theory
- a series of steps followed to solve problems is
a. the scientific method
c. experimental guidelines
b. investigations
d. standard procedures
- the graph to use if i want to compare the price of six different cars would be a
a. pie graph
c. bar graph
b. data table
d. line graph
- a biologist in a laboratory reports a new discovery based on experimental results. if the experimental results are valid, biologists in other laboratories should be able to
a. repeat the same experiment with a different variable and obtain the same results
b. perform the same experiment and obtain different results
c. repeat the same experiment and obtain the same results
d. perform the same experiment under different experimental conditions and obtain the same results
- a sample that is treated exactly like the other experimental groups except that the variable is not applied to it is a(n) ______________.
a. observation
c. control
b. variable
d. hypothesis
- this type of graph does not have an x or y axis.
a. pie chart
c. bar graph
b. scatter plot
d. line graph
- The control group is the one not exposed to the test variable (fertilizer here).
- A procedure to test hypotheses/discover facts is defined as an experiment.
- The scientific method is a standardized step-by-step problem-solving process.
- Bar graphs are used to compare discrete categories (like different car prices).
- Valid experimental results must be reproducible by others doing the same experiment.
- A control group matches experimental groups but lacks the test variable.
- Pie charts represent proportions without x/y axes, unlike other graph types.

Snap & solve any problem in the app
Get step-by-step solutions on Sovi AI
Photo-based solutions with guided steps
Explore more problems and detailed explanations
- d. Plant A
- b. Experiment
- a. The scientific method
- c. Bar graph
- c. Repeat the same experiment and obtain the same results
- c. Control
- a. Pie chart