QUESTION IMAGE
Question
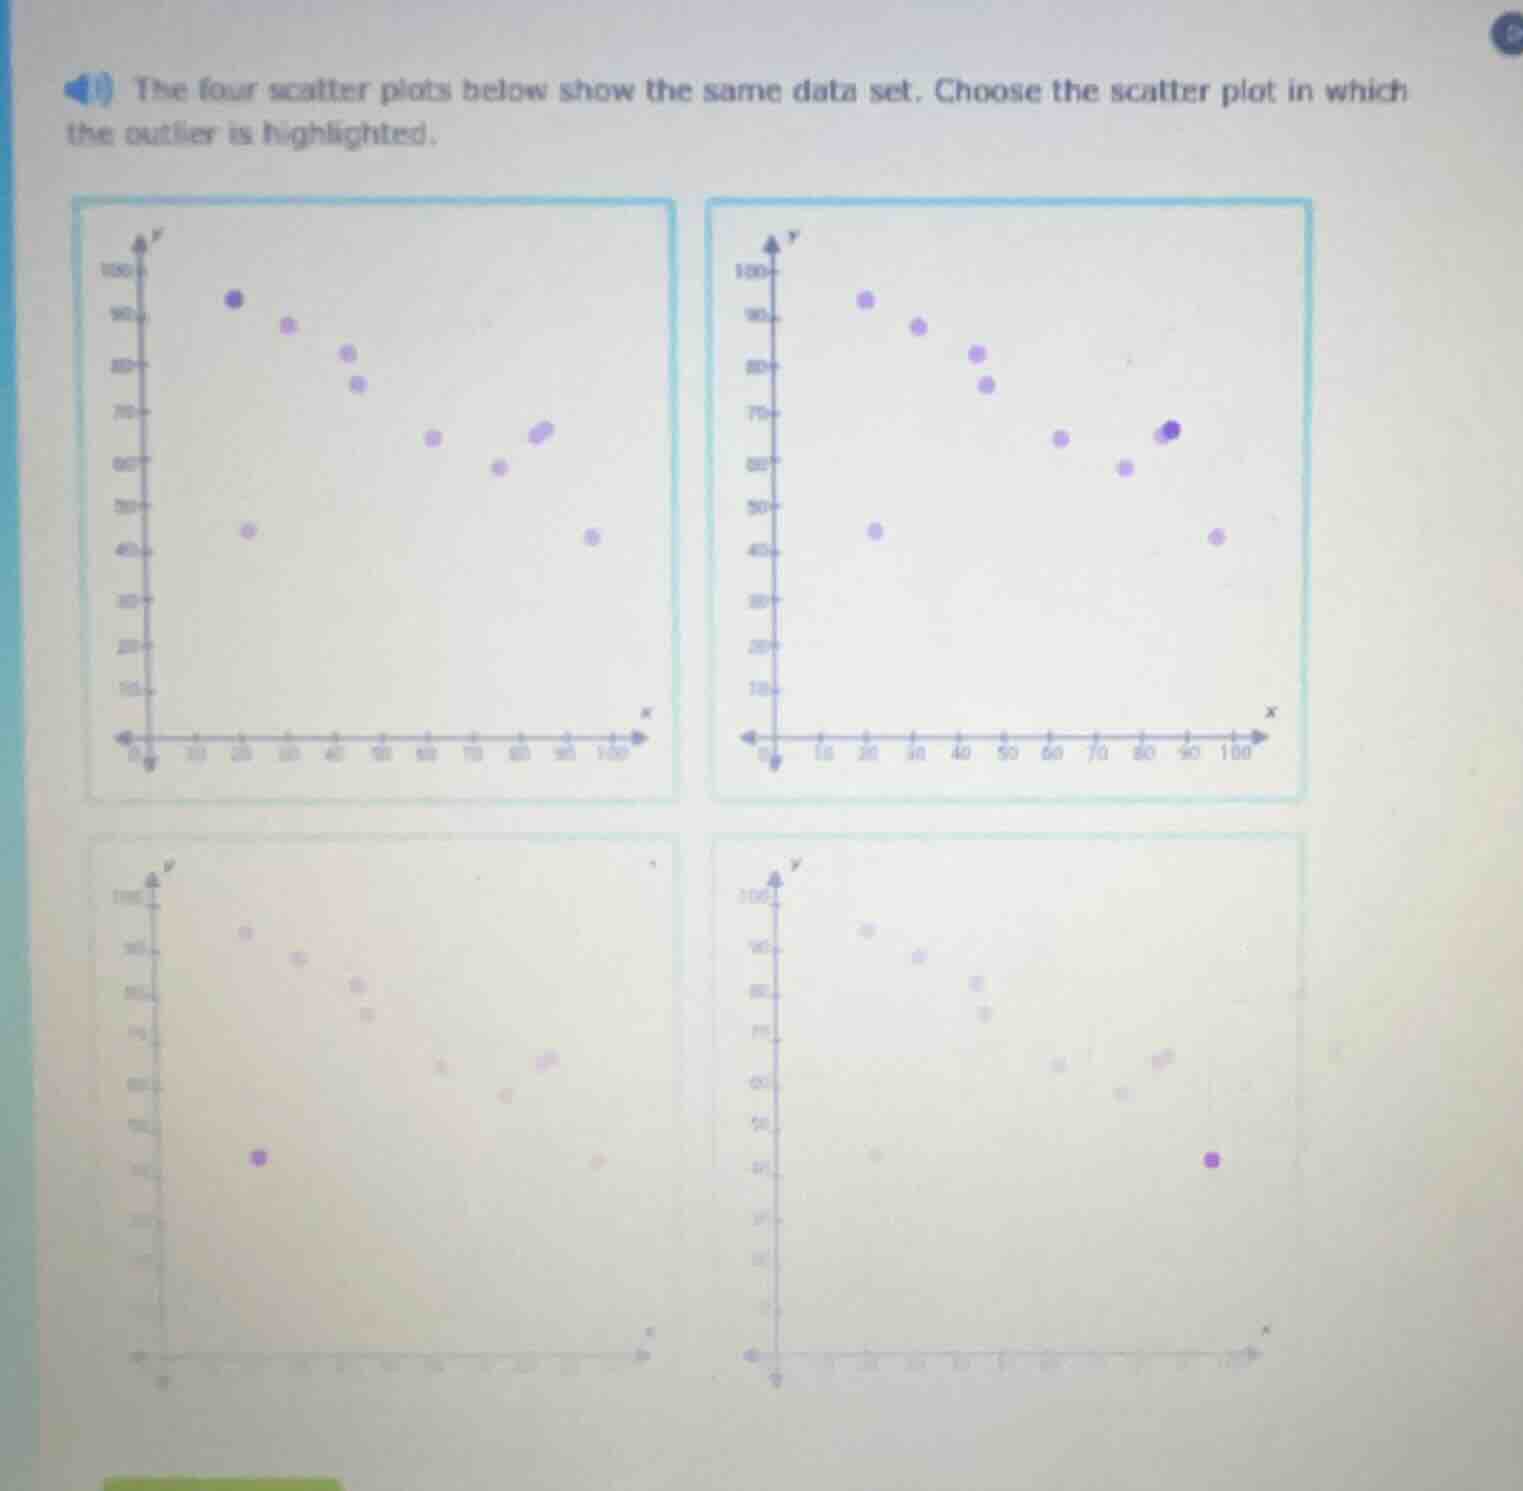
the four scatter plots below show the same data set. choose the scatter plot in which the outlier is highlighted.
Brief Explanations
An outlier is a data point that lies far outside the general cluster of other data points. Looking at all four scatter plots, the bottom-left plot has a highlighted point that is separated from the main group of points, while the other plots either highlight a point within the cluster or misidentify an outlier.

Snap & solve any problem in the app
Get step-by-step solutions on Sovi AI
Photo-based solutions with guided steps
Explore more problems and detailed explanations
The bottom-left scatter plot (with the highlighted point at low x, low y, far from the main data cluster)