QUESTION IMAGE
Question
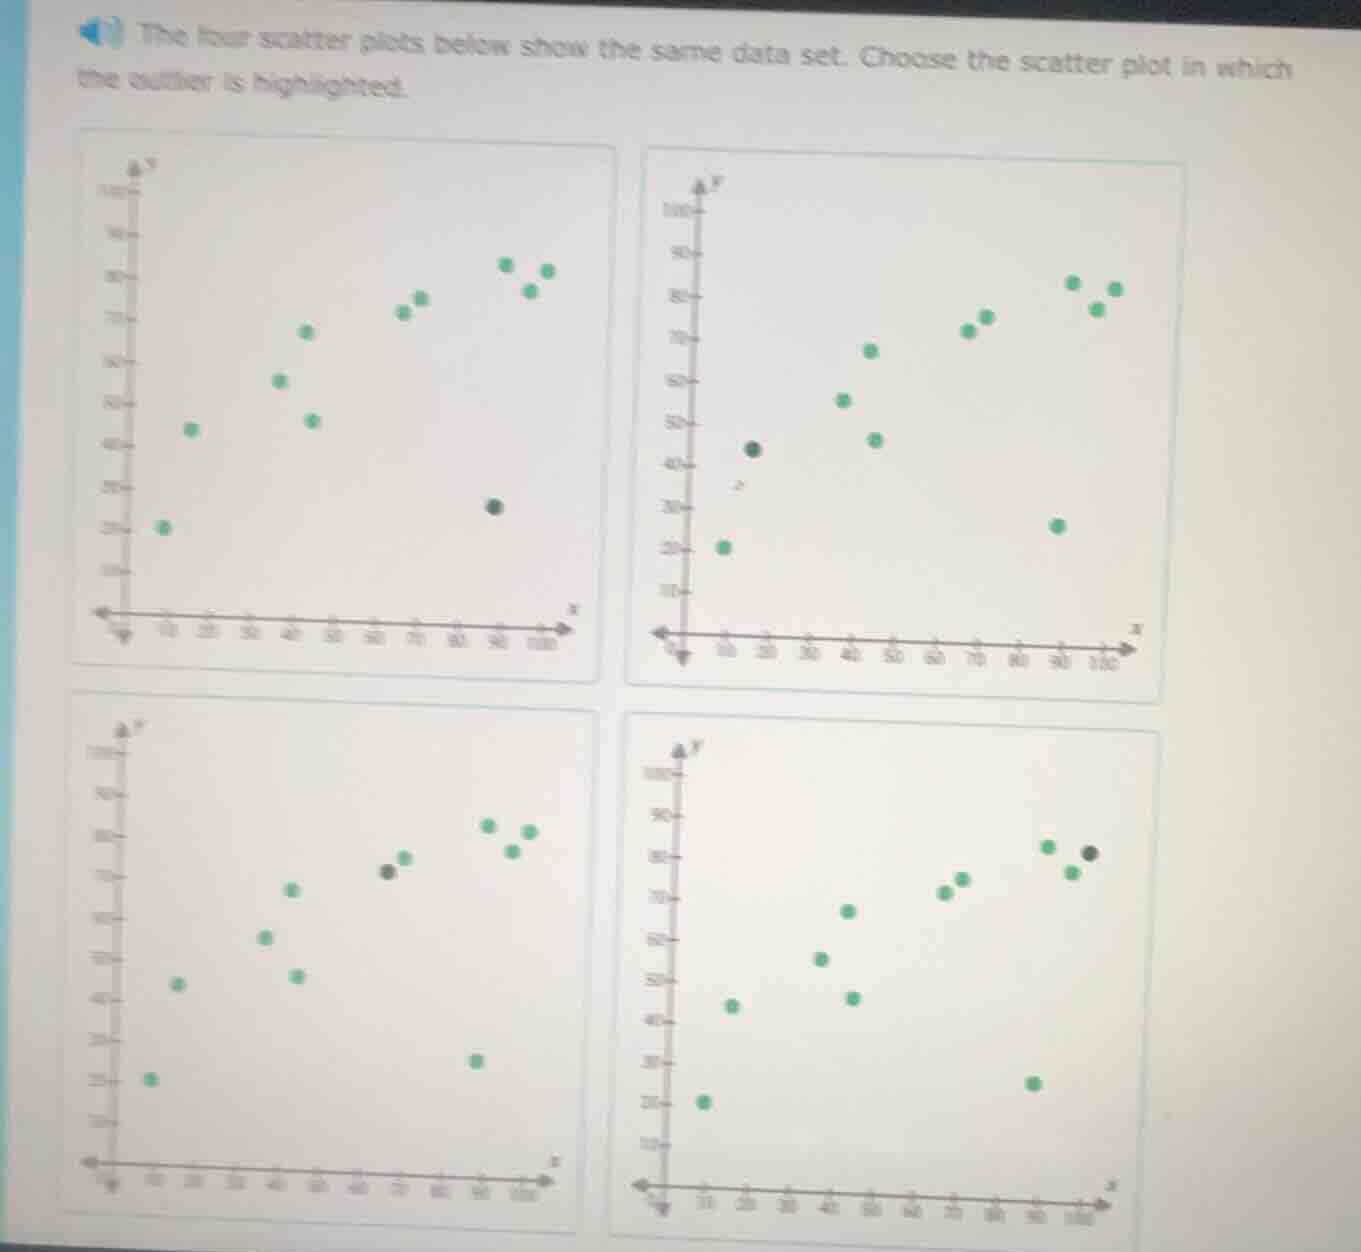
the four scatter plots below show the same data set. choose the scatter plot in which the outlier is highlighted.
Brief Explanations
An outlier is a data point that lies far outside the general cluster of other data points. Looking at all four plots, the top-left scatter plot has a point at (90, 25) which is distant from the main group of points that follow an upward trend, while the highlighted points in the other plots are within or close to the main data cluster.

Snap & solve any problem in the app
Get step-by-step solutions on Sovi AI
Photo-based solutions with guided steps
Explore more problems and detailed explanations
Top-left scatter plot (the one with the dark point at x=90, y≈25)