QUESTION IMAGE
Question
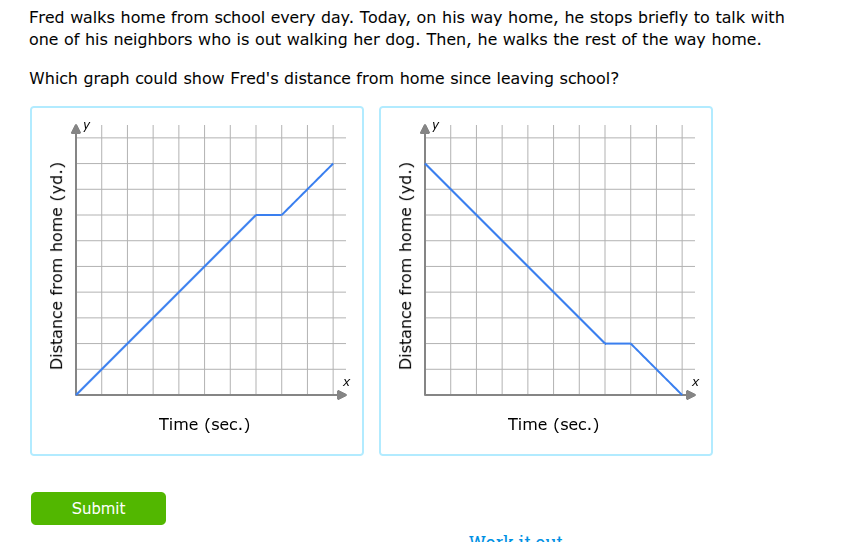
fred walks home from school every day. today, on his way home, he stops briefly to talk with one of his neighbors who is out walking her dog. then, he walks the rest of the way home. which graph could show freds distance from home since leaving school?
Step1: Analyze starting condition
Fred starts at school, so his initial distance from home is a positive value (not 0).
Step2: Analyze movement phase 1
As he walks toward home, his distance from home decreases over time: this is a downward-sloping linear segment.
Step3: Analyze the stop phase
When he stops to talk, his distance from home does not change for a period: this is a horizontal flat segment.
Step4: Analyze movement phase 2
When he resumes walking home, his distance from home decreases again until it reaches 0 (when he arrives home): this is a final downward-sloping linear segment ending at y=0.

Snap & solve any problem in the app
Get step-by-step solutions on Sovi AI
Photo-based solutions with guided steps
Explore more problems and detailed explanations
The graph on the right (starting at a high y-value, decreasing linearly, flat for a segment, then decreasing linearly to 0)