QUESTION IMAGE
Question
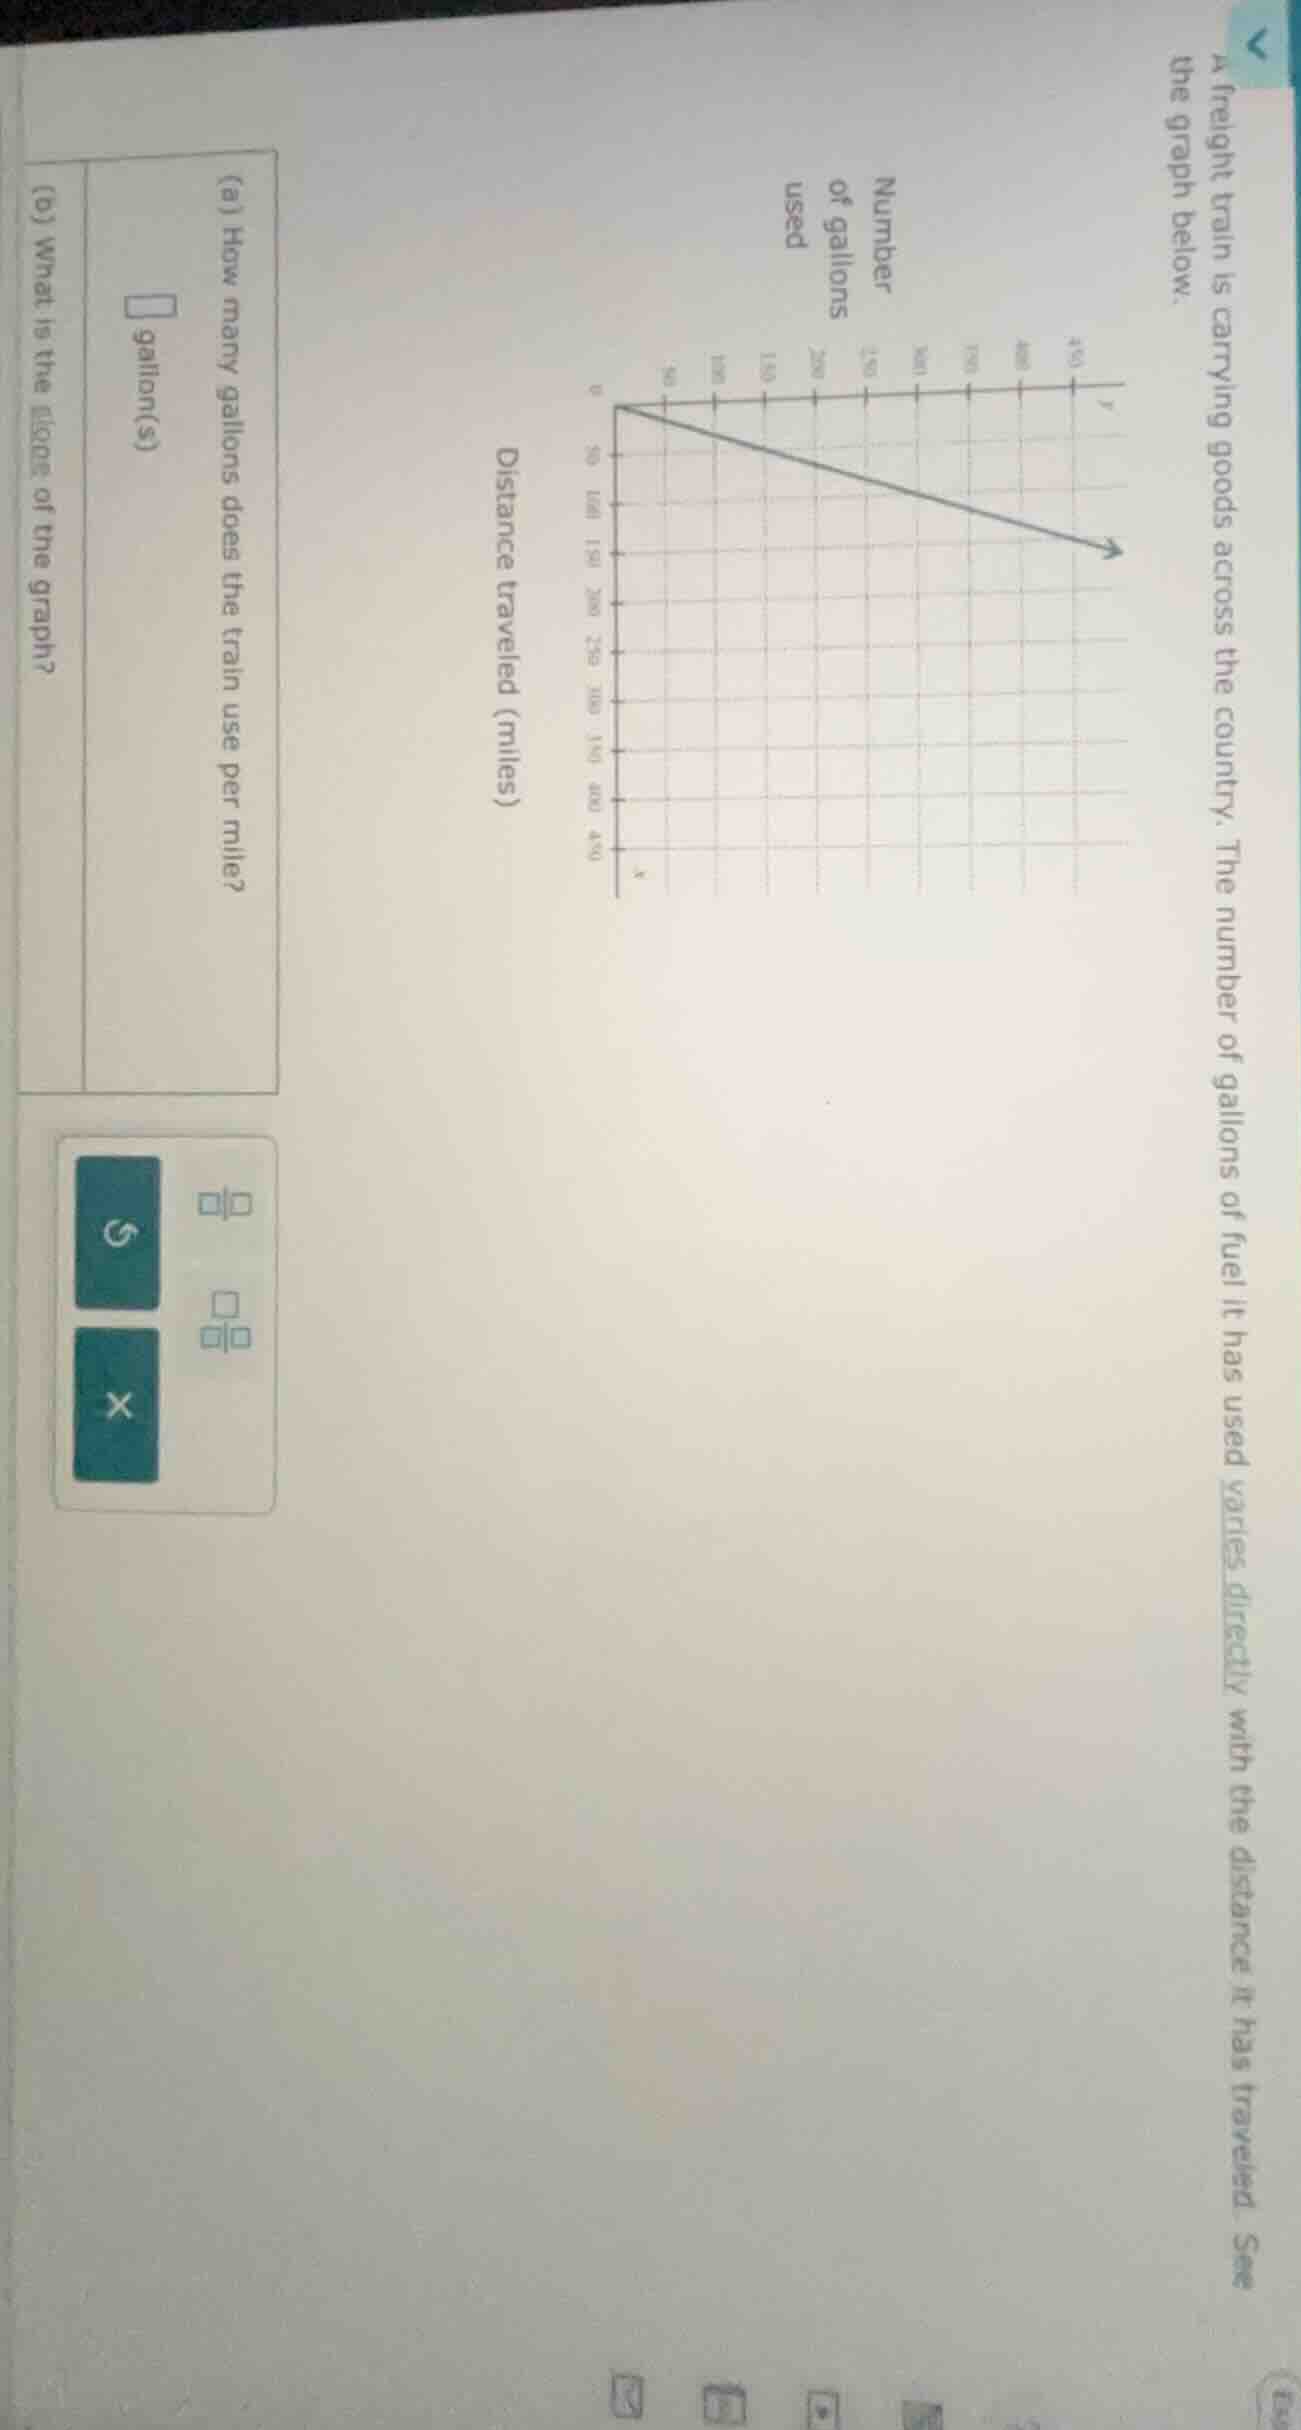
a freight train is carrying goods across the country. the number of gallons of fuel it has used varies directly with the distance it has traveled. see the graph below.
(a) how many gallons does the train use per mile?
square gallon(s)
(b) what is the slope of the graph?
Part (a)
Step1: Identify two points on the graph
From the graph, we can see that when the distance traveled \( x = 0 \) miles, the number of gallons used \( y = 0 \) gallons. Another point: when \( x = 420 \) miles, let's assume (from the direct variation and the graph's scale) \( y = 35 \) gallons (since the line goes from (0,0) to (420, 35) approximately, as the y - axis has 35 at the top? Wait, maybe better to check the ratio. Wait, direct variation means \( y=kx \), so \( k=\frac{y}{x} \). Let's take a point. Suppose when \( x = 60 \) miles, \( y = 5 \) gallons? Wait, maybe the graph has a point like (420, 35). Let's confirm: if we take \( x = 420 \) miles and \( y = 35 \) gallons. Then the rate (gallons per mile) is \( \frac{y}{x}=\frac{35}{420} \).
Step2: Simplify the ratio
Simplify \( \frac{35}{420} \). Divide numerator and denominator by 35: \( \frac{35\div35}{420\div35}=\frac{1}{12} \)? Wait, no, 3512 = 420. Wait, 35/420 = 1/12? Wait, no, 35 divided by 420: 420 ÷ 35 = 12, so 35/420 = 1/12? Wait, no, 3512 = 420, so 35/420 = 1/12. Wait, but maybe the graph has a point (60,5). Let's check: 5/60 = 1/12. Yes, that makes sense. So the train uses \( \frac{1}{12} \) gallons per mile? Wait, no, wait: gallons per mile is \( \frac{\text{gallons}}{\text{miles}} \). Wait, if it's direct variation, \( y = kx \), where \( y \) is gallons, \( x \) is miles. So \( k=\frac{y}{x} \). Let's take \( x = 60 \) miles, \( y = 5 \) gallons (from the graph: when x=60, y=5). Then \( k=\frac{5}{60}=\frac{1}{12} \) gallons per mile.
Step1: Recall the slope formula for direct variation
For a direct variation graph \( y = kx \), the slope \( k \) is the constant of proportionality. From part (a), we found that \( k=\frac{1}{12} \) (gallons per mile). Wait, no, the slope of the graph (in terms of \( y \) vs \( x \), where \( y \) is gallons and \( x \) is miles) is \( \frac{\text{change in }y}{\text{change in }x} \). From part (a), we found that the rate (gallons per mile) is \( \frac{1}{12} \), so the slope of the graph (since it's a direct variation, the line passes through the origin) is equal to the constant of proportionality \( k \), which is \( \frac{1}{12} \). Alternatively, if we take two points (0,0) and (420, 35), the slope \( m=\frac{35 - 0}{420 - 0}=\frac{35}{420}=\frac{1}{12} \).

Snap & solve any problem in the app
Get step-by-step solutions on Sovi AI
Photo-based solutions with guided steps
Explore more problems and detailed explanations
\(\frac{1}{12}\)