QUESTION IMAGE
Question
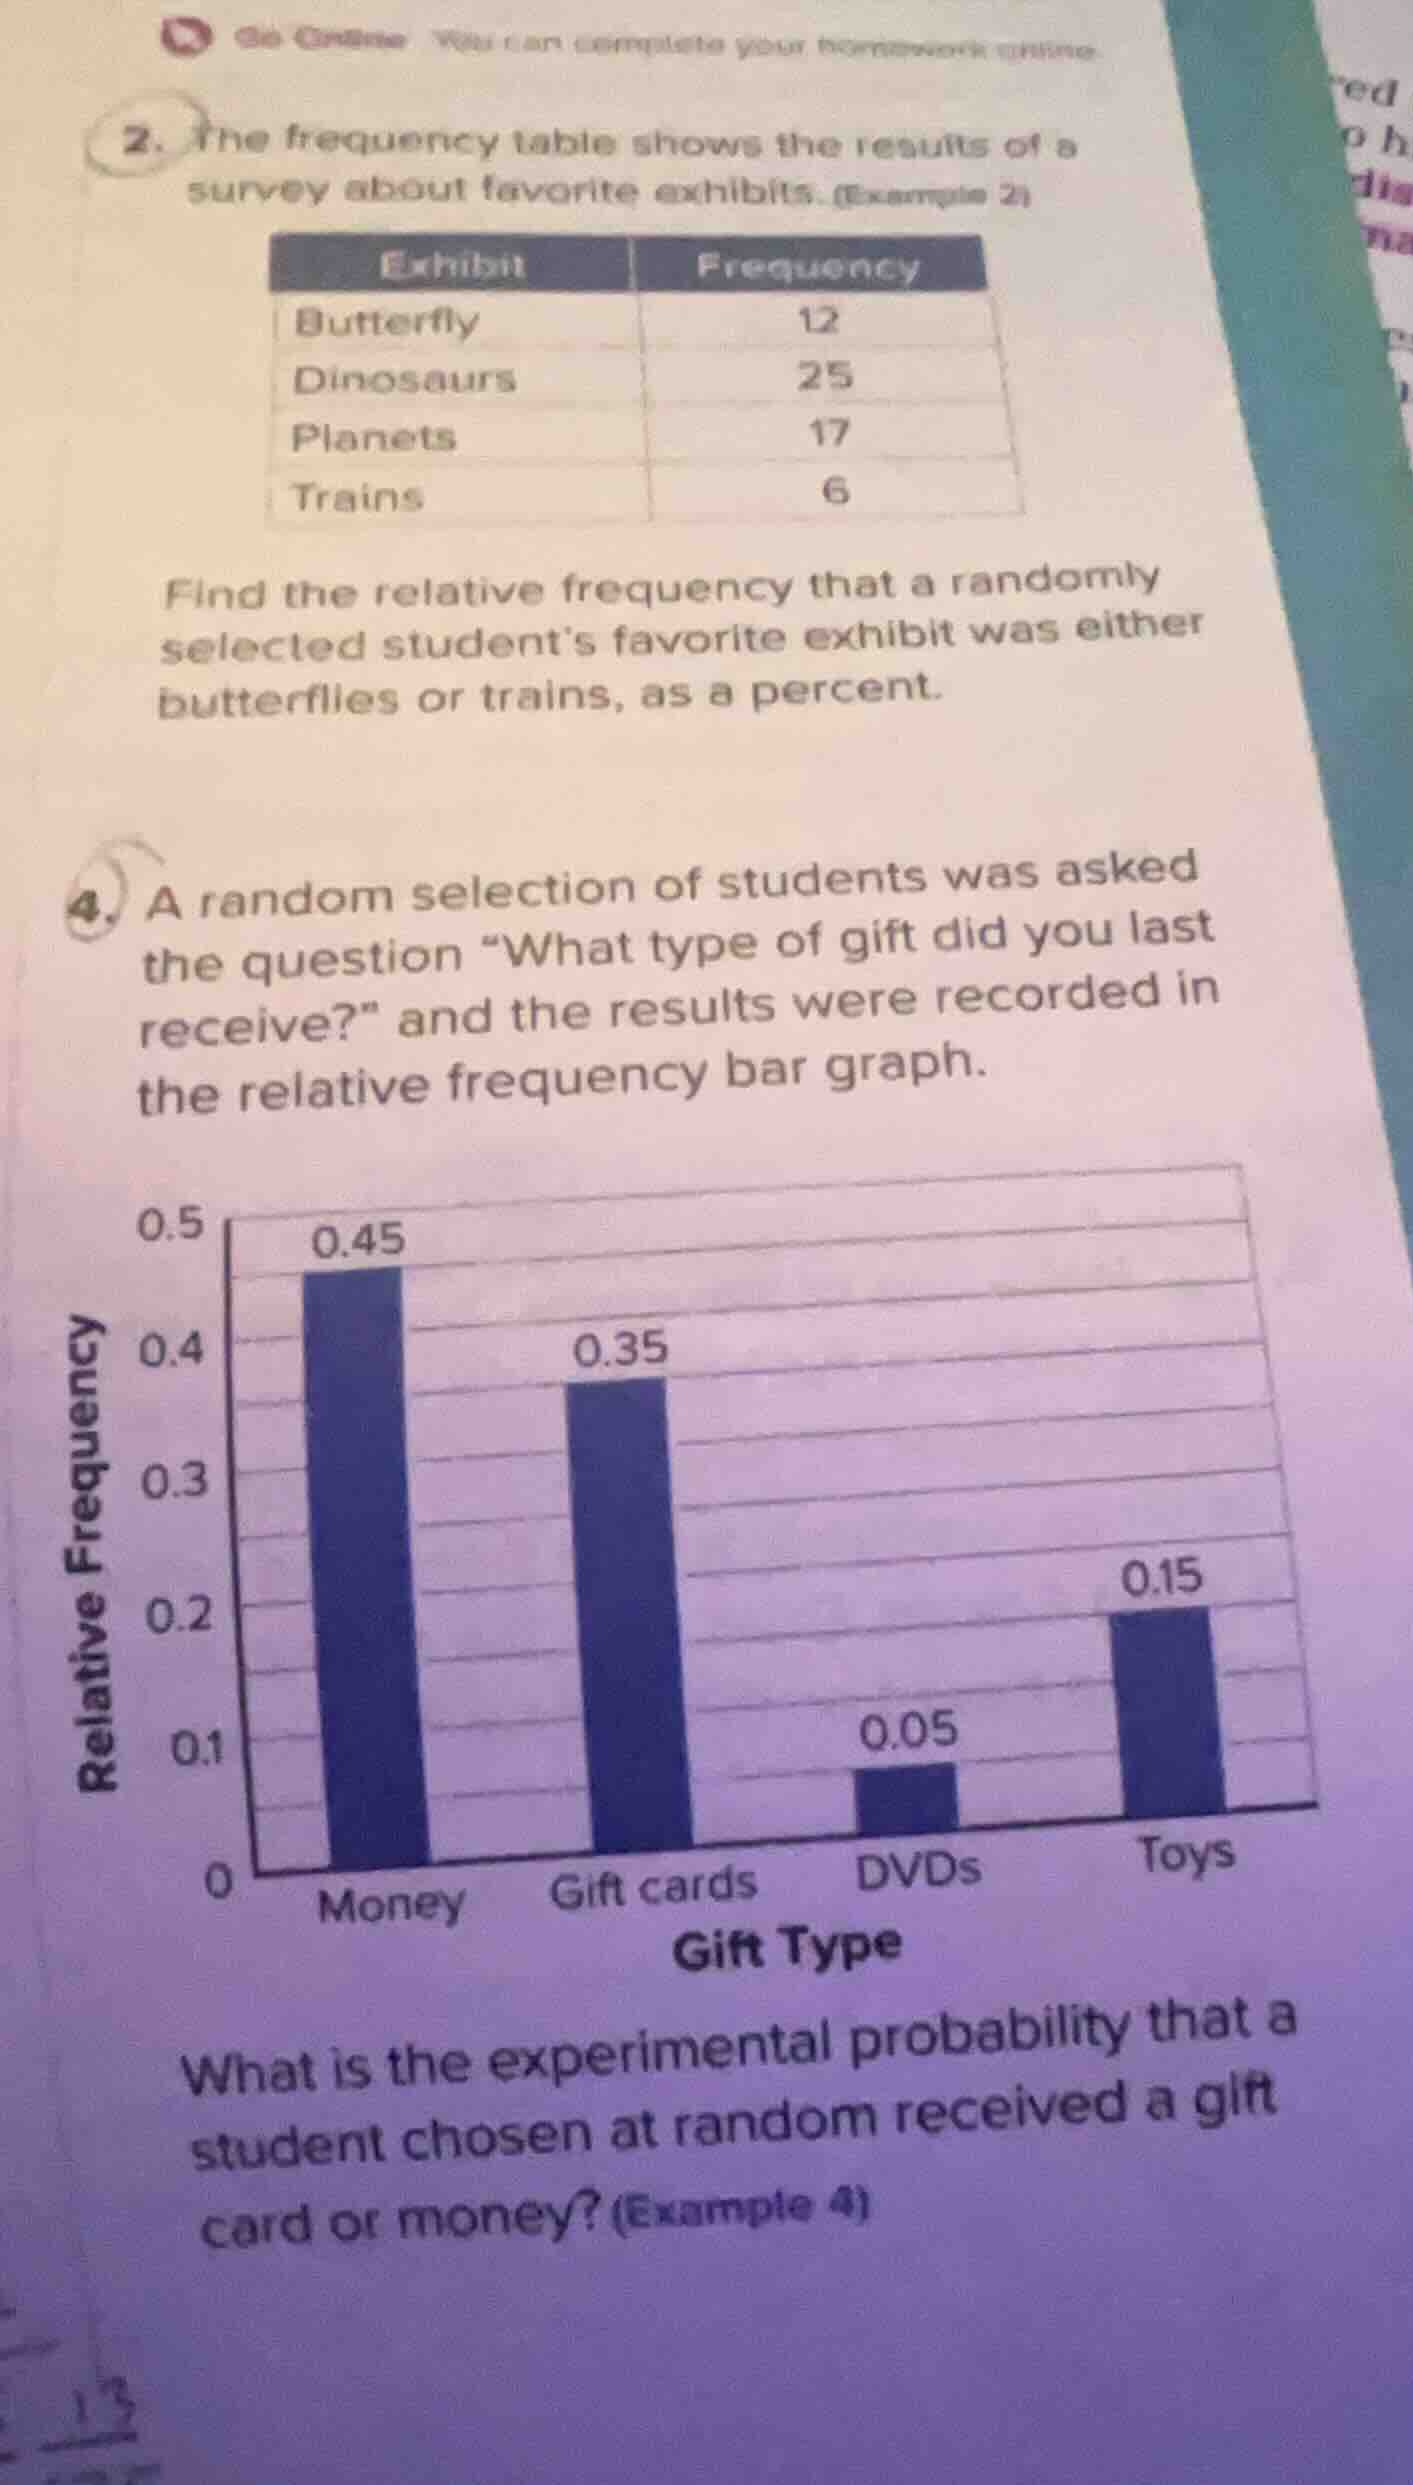
- the frequency table shows the results of a survey about favorite exhibits. (example 2)|exhibit|frequency|| ---- | ---- ||butterfly|12||dinosaurs|25||planets|17||trains|6|find the relative frequency that a randomly selected students favorite exhibit was either butterflies or trains, as a percent.4. a random selection of students was asked the question \what type of gift did you last receive?\ and the results were recorded in the relative frequency bar graph.what is the experimental probability that a student chosen at random received a gift card or money? (example 4)
Step1: Calculate total survey respondents (Q2)
$\text{Total} = 12 + 25 + 17 + 6 = 60$
Step2: Sum target frequencies (Q2)
$\text{Butterfly + Trains} = 12 + 6 = 18$
Step3: Compute relative frequency (Q2)
$\text{Relative Frequency} = \frac{18}{60} \times 100\% = 30\%$
Step4: Sum target relative frequencies (Q4)
$\text{Gift card + Money} = 0.45 + 0.35 = 0.8$

Snap & solve any problem in the app
Get step-by-step solutions on Sovi AI
Photo-based solutions with guided steps
Explore more problems and detailed explanations
- 30%
- 0.8