QUESTION IMAGE
Question
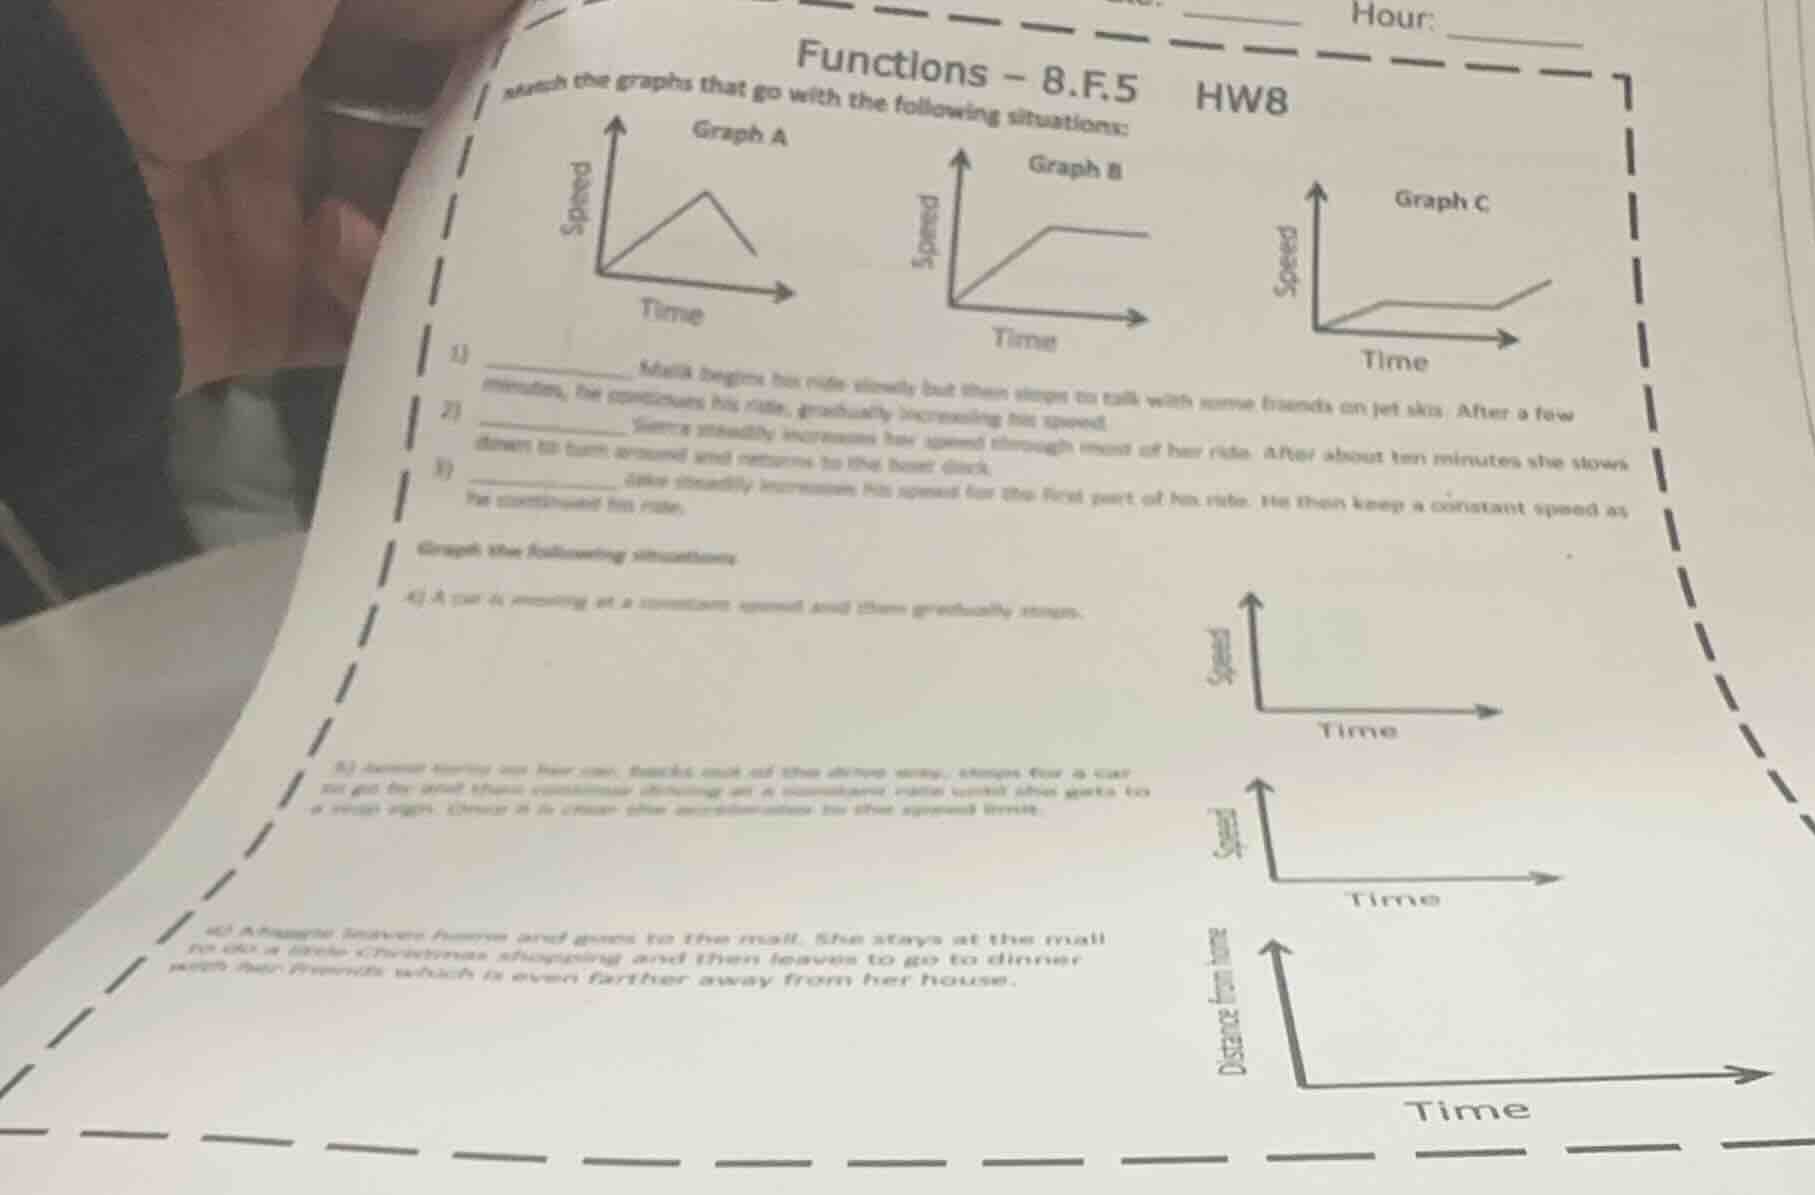
functions - 8.f.5 hw8
match the graphs that go with the following situations:
graph a (speed vs time, triangle), graph b (speed vs time, increasing then constant), graph c (speed vs time, increasing, constant, then increasing)
- ____ malik begins his ride slowly but then stops to talk with some friends on jet skis. after a few minutes, he continues his ride, gradually increasing his speed.
- ____ sierra steadily increases her speed through most of her ride. after about ten minutes she slows down to turn around and returns to the boat dock.
- ____ jake steadily increases his speed for the first part of his ride. he then keeps a constant speed as he continues his ride.
graph the following situations:
- a car is moving at a constant speed and then gradually stops. (speed vs time axis)
- (partially visible) ... starts out her day, ... drops off ... changes for a car ... get to golf ... continues driving at a constant rate until she gets to a stop sign. (speed vs time axis)
- a daughter leaves home and goes to the mall. she stays at the mall to do a little christmas shopping and then leaves to go to dinner with her friends which is even farther away from her house. (distance from home vs time axis)
1) Analyze Malik's situation
Malik starts slowly (speed increases slowly), stops (speed constant at 0 or flat), then increases speed. Graph C has a flat part (stopping) and then speed increases. So 1) matches Graph C.
2) Analyze Sierra's situation
Sierra increases speed, then slows down (speed decreases) to turn around. Graph A has a peak (increase then decrease) which matches speeding up then slowing down. So 2) matches Graph A.
3) Analyze Jake's situation
Jake increases speed then keeps constant speed. Graph B has an increase then a flat line (constant speed). So 3) matches Graph B.
4) Analyze car's situation (constant speed then gradually stops)
The speed starts constant (flat line) then decreases to 0. The first speed - time graph (with speed on y - axis) should have a flat part then a decreasing line to 0.
5) Analyze driver's situation (starts, stops, changes car, drives constant, then accelerates)
The speed - time graph: starts with increase, flat (stopped), then increase (accelerate) after changing car. The second speed - time graph would have these phases.
6) Analyze daughter's situation (distance from home)
She goes to mall (distance increases), stays (distance constant), then goes to dinner (distance increases more). The distance - time graph (with distance on y - axis) has an increase, flat, then increase.

Snap & solve any problem in the app
Get step-by-step solutions on Sovi AI
Photo-based solutions with guided steps
Explore more problems and detailed explanations
s:
- Graph C
- Graph A
- Graph B
- The speed - time graph with a flat line then a decreasing line to 0.
- The speed - time graph with increase, flat, then increase.
- The distance - time graph with increase, flat, then increase.