QUESTION IMAGE
Question
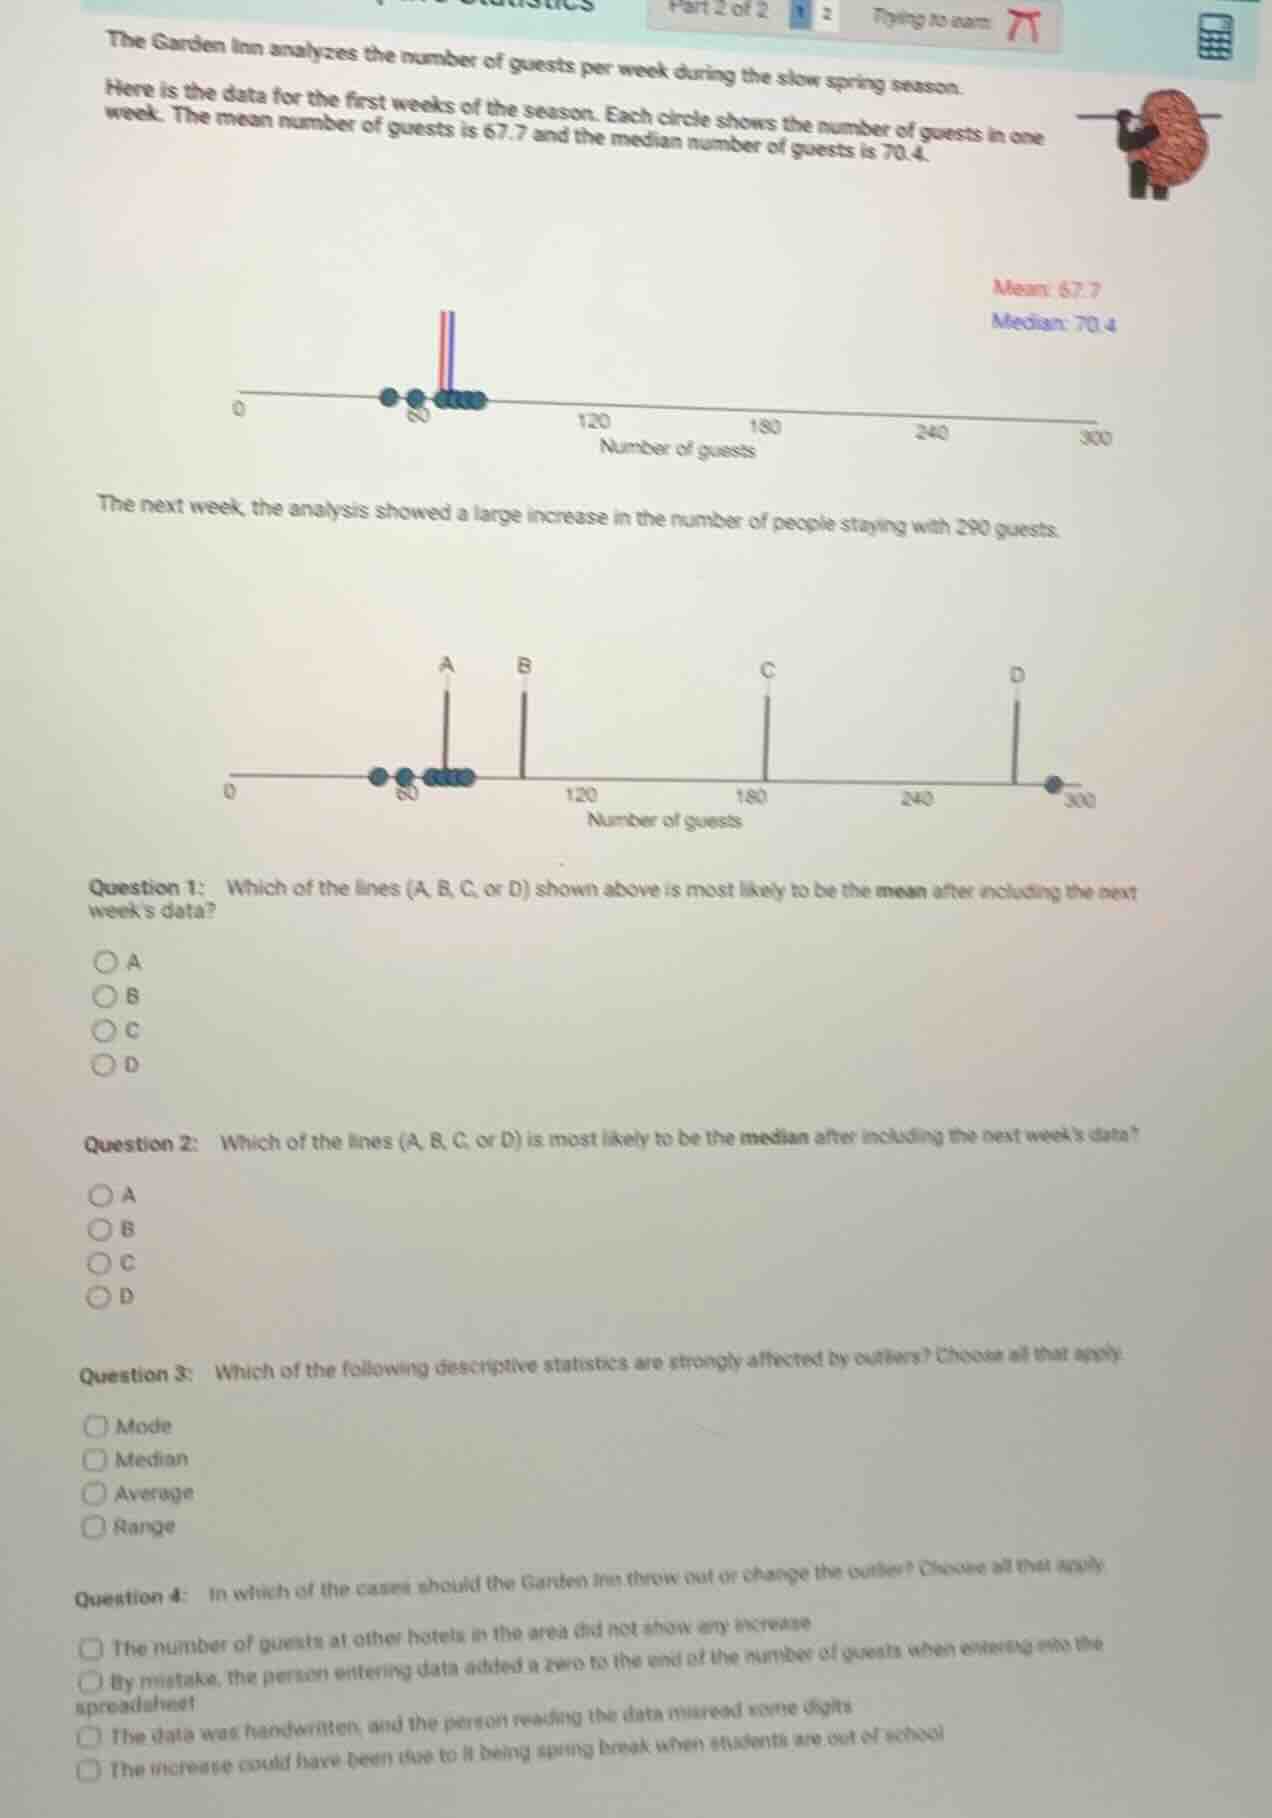
the garden inn analyzes the number of guests per week during the slow spring season. here is the data for the first weeks of the season. each circle shows the number of guests in one week. the mean number of guests is 67.7 and the median number of guests is 70.4. the next week, the analysis showed a large increase in the number of people staying with 290 guests. question 1: which of the lines (a, b, c, or d) shown above is most likely to be the mean after including the next week’s data? a b c d question 2: which of the lines (a, b, c, or d) is most likely to be the median after including the next week’s data? a b c d question 3: which of the following descriptive statistics are strongly affected by outliers? choose all that apply. mode median average range question 4: in which of the cases should the garden inn throw out or change the outlier? choose all that apply. the number of guests at other hotels in the area did not show any increase by mistake, the person entering data added a zero to the end of the number of guests when entering into the spreadsheet the data was handwritten, and the person reading the data misread some digits the increase could have been due to it being spring break when students are out of school
Question 1
Step1: Recall mean sensitivity to outliers
The mean is pulled toward extreme values. Original mean = 67.7, new data point = 290 (an outlier far above existing data). We calculate the new mean:
Let original number of weeks = $n$. Original total guests: $67.7n$. New total = $67.7n + 290$, new count = $n+1$. From the first plot, $n=7$ (7 circles).
New total = $67.7*7 + 290 = 473.9 + 290 = 763.9$
New mean = $\frac{763.9}{8} = 95.4875$, which is near line B.
Question 2
Step1: Recall median resistance to outliers
Original median (7 data points) is the 4th value = 70.4. With 8 data points, new median is average of 4th and 5th values, both still in the original clustered data, so it stays near the original median (line A).
Question 3
Step1: Identify outlier-sensitive stats
Mean (average) is pulled by outliers; range = max - min, so an outlier increases max drastically. Median and mode are resistant.
Question 4
Step1: Identify valid outlier removal cases
Outliers are only removed if they are data entry errors. Spring break or other hotels not increasing are valid real-world outliers, not errors.

Snap & solve any problem in the app
Get step-by-step solutions on Sovi AI
Photo-based solutions with guided steps
Explore more problems and detailed explanations
- B
- A
- Average, Range
- By mistake, the person entering data added a zero to the end of the number of guests when entering into the spreadsheet; The data was handwritten, and the person reading the data misread some digits