QUESTION IMAGE
Question
given the following box plots, answer the questions.
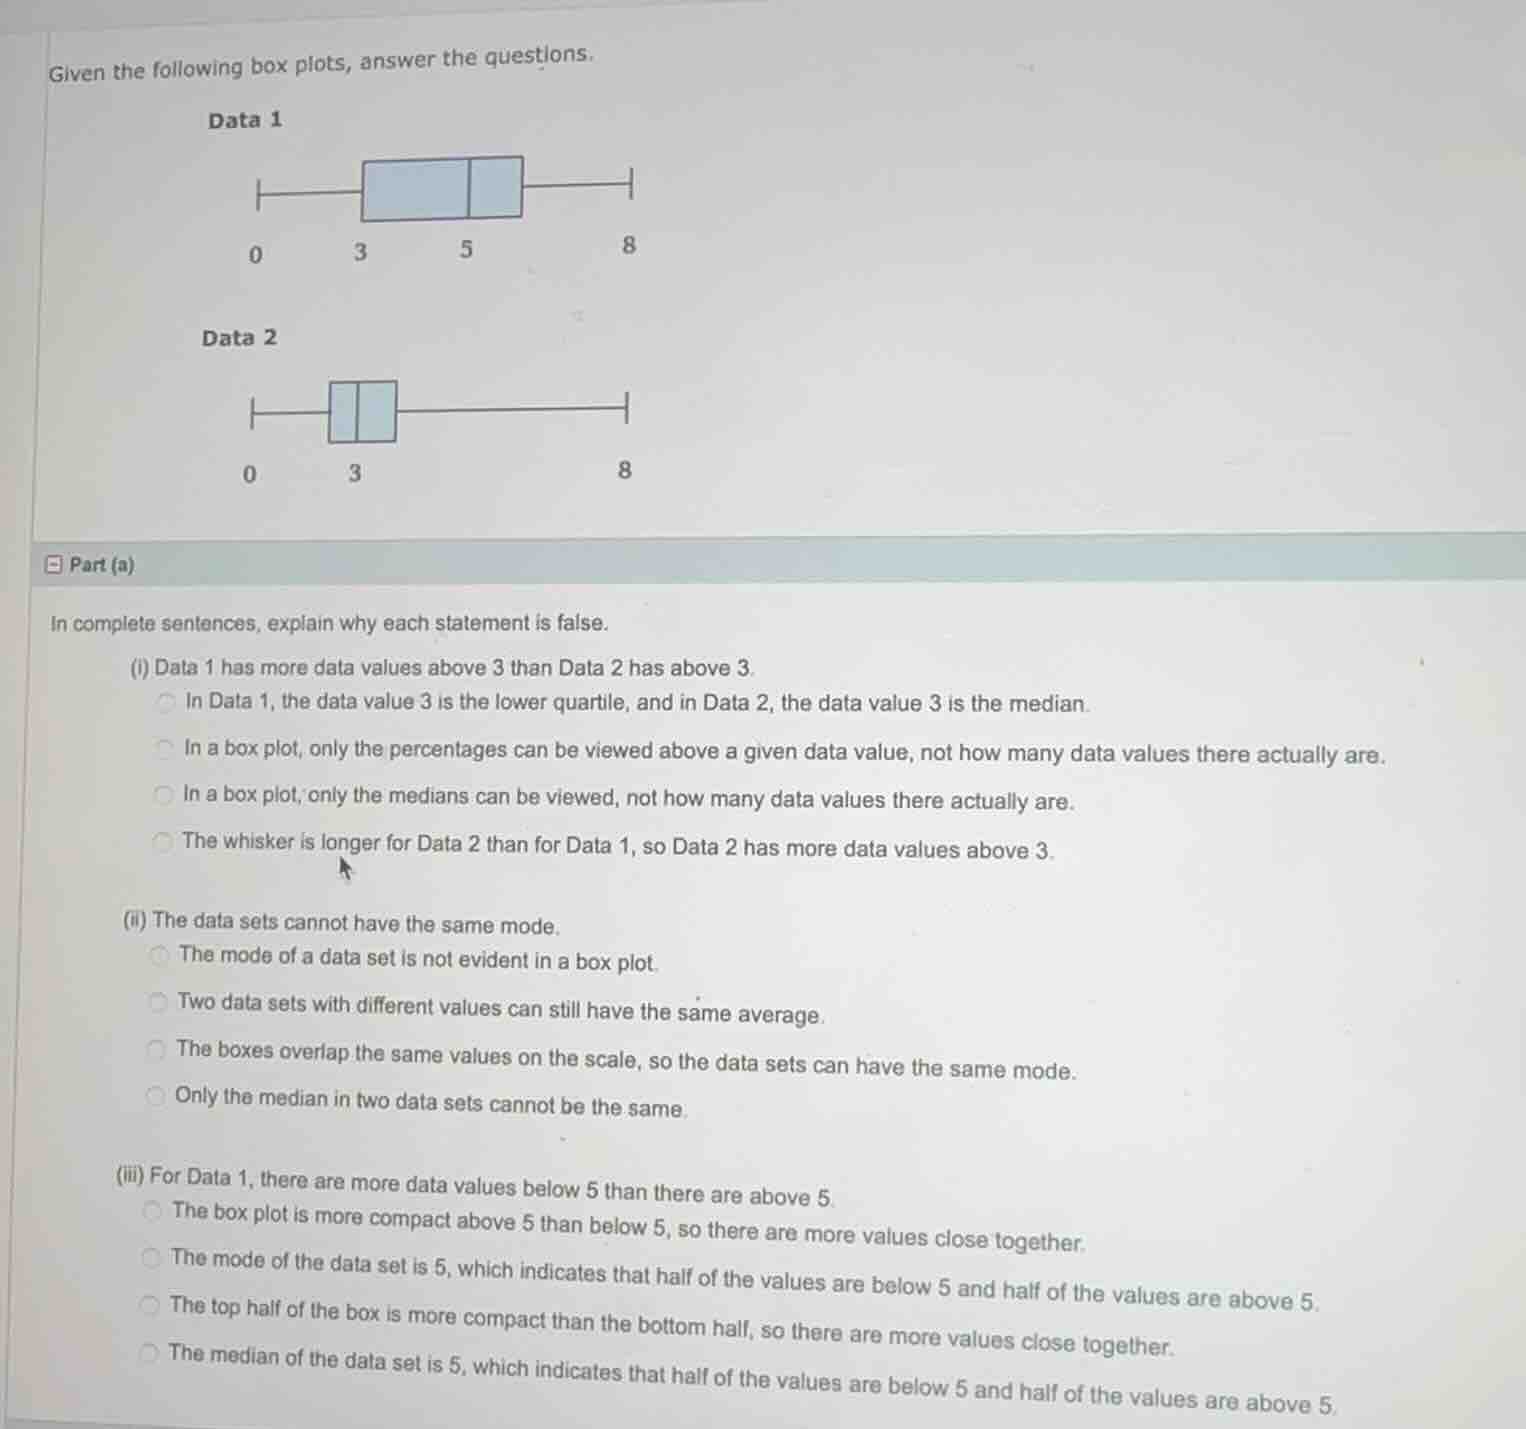
data 1
box plot with 0, 3, 5, 8
data 2
box plot with 0, 3, 8
part (a)
in complete sentences, explain why each statement is false.
(i) data 1 has more data values above 3 than data 2 has above 3.
options: in data 1, the data value 3 is the lower quartile, and in data 2, the data value 3 is the median. / in a box plot, only the percentages can be viewed above a given data value, not how many data values there actually are. / in a box plot, only the medians can be viewed, not how many data values there actually are. / the whisker is longer for data 2 than for data 1, so data 2 has more data values above 3.
(ii) the data sets cannot have the same mode.
options: the mode of a data set is not evident in a box plot. / two data sets with different values can still have the same average. / the boxes overlap the same values on the scale, so the data sets can have the same mode. / only the median in two data sets cannot be the same.
(iii) for data 1, there are more data values below 5 than there are above 5.
options: the box plot is more compact above 5 than below 5, so there are more values close together. / the mode of the data set is 5, which indicates that half of the values are below 5 and half of the values are above 5. / the top half of the box is more compact than the bottom half, so there are more values close together. / the median of the data set is 5, which indicates that half of the values are below 5 and half of the values are above 5.
Part (a)(i)
A box plot shows the distribution in terms of quartiles (percentages of data) but not the actual number of data points. So we can't tell the count of data values above 3 from the box plot alone, making the statement false. The correct reasoning is that in a box plot, only the percentages (quartile - related proportions) can be inferred above a given data value, not the actual count of data values.
A box plot does not display the mode (the most frequently occurring value) of a data set. So we can't conclude that the two data sets can't have the same mode because the box plot doesn't show mode - related information.
The median of a data set (which is the line inside the box, here 5 for Data 1) divides the data into two equal halves. So half of the data values are below the median (5) and half are above it. Thus, the statement that there are more data values below 5 than above is false.

Snap & solve any problem in the app
Get step-by-step solutions on Sovi AI
Photo-based solutions with guided steps
Explore more problems and detailed explanations
In a box plot, only the percentages can be viewed above a given data value, not how many data values there actually are.