QUESTION IMAGE
Question
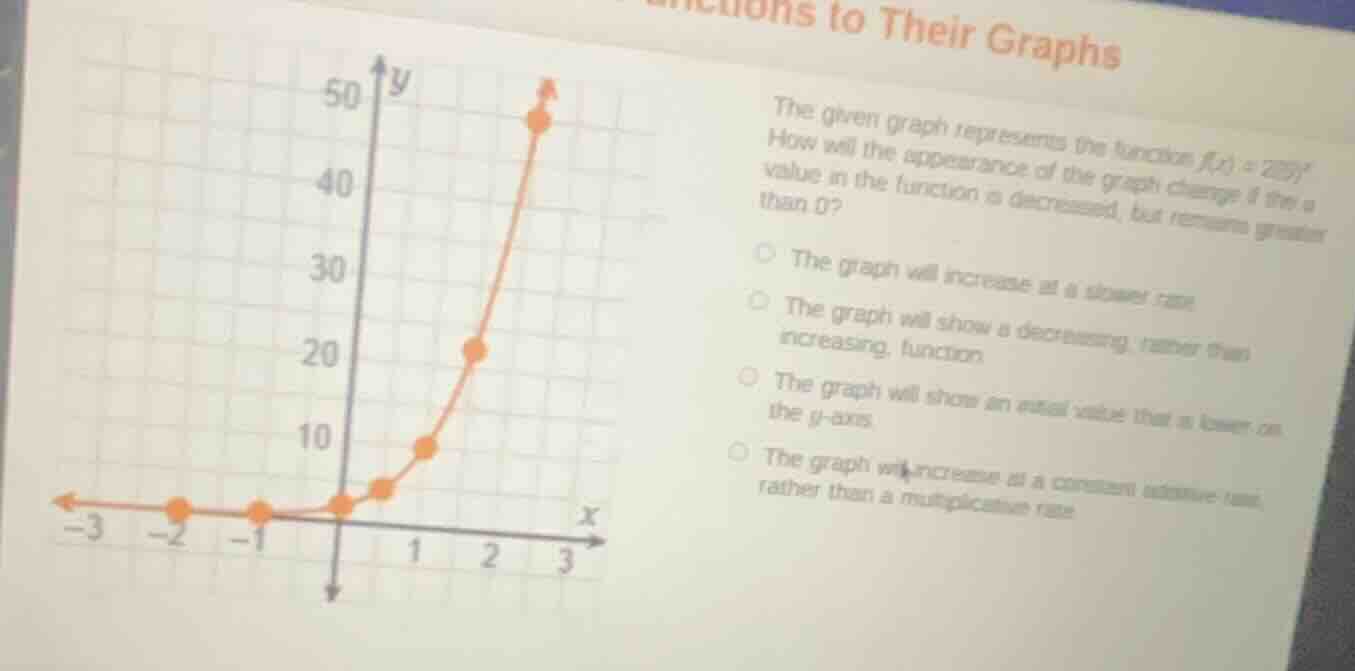
the given graph represents the function f(x) = 2(5)^x. how will the appearance of the graph change if the a value in the function is decreased, but remains greater than 0?
- the graph will increase at a slower rate
- the graph will show a decreasing, rather than increasing, function
- the graph will show an initial value that is lower on the y - axis
- the graph will increase at a constant additive rate, rather than a multiplicative rate
The function \(f(x)=2(5)^x\) is an exponential growth function where \(a=2\) (initial value) and the base \(5>1\) (growth factor). When the base (the "a value" referenced, likely a typo for the base of the exponential) is decreased but remains greater than 0, if it stays greater than 1, the growth rate slows; if it becomes between 0 and 1, it becomes decay. However, the option about slower growth is the only consistent choice when the base is reduced but still >1 (the problem states it remains greater than 0, and the original is growth, so the intended change is reducing the growth base). The initial value (y-intercept) is determined by the coefficient 2, which is not changed here, so the y-intercept doesn't shift. Exponential functions never grow at a constant additive rate (that's linear), and it only becomes decreasing if the base is between 0 and 1, which is not guaranteed by just "decreased but >0".

Snap & solve any problem in the app
Get step-by-step solutions on Sovi AI
Photo-based solutions with guided steps
Explore more problems and detailed explanations
The graph will increase at a slower rate