QUESTION IMAGE
Question
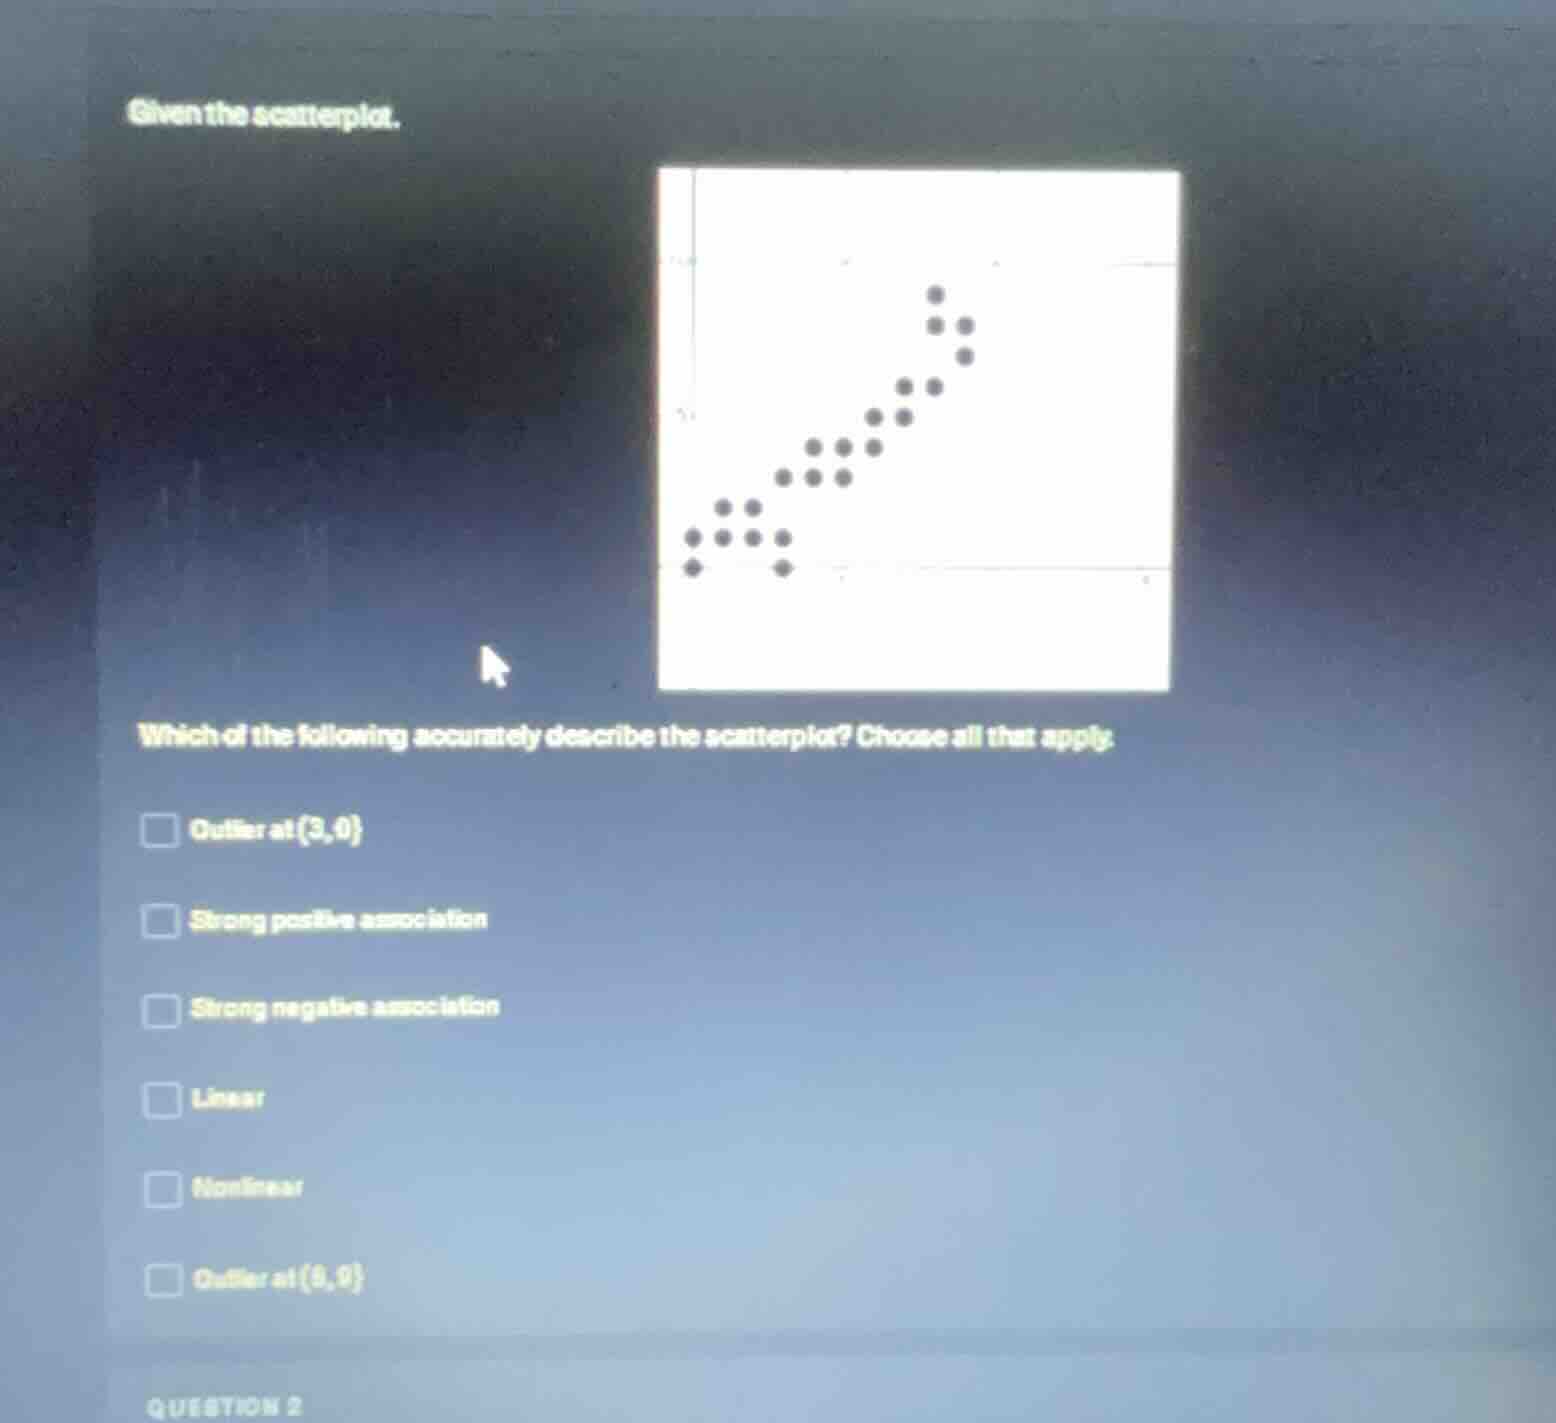
given the scatterplot.
which of the following accurately describe the scatterplot? choose all that apply.
outlier at (3,0)
strong positive association
strong negative association
linear
nonlinear
outlier at (9,0)
question 2
Brief Explanations
- Outlier at (3,0): The point at (3,0) is far from the main cluster of points, making it an outlier.
- Strong positive association: As the x-values increase, the y-values consistently increase, and the points are tightly clustered, indicating a strong positive relationship.
- Linear: The overall pattern of the points (excluding the outlier) follows a straight, upward trend, so the association is linear.
- The other options are incorrect: there is no strong negative association (values don't decrease together), the relationship is not nonlinear, and (8,9) is part of the main cluster, not an outlier.

Snap & solve any problem in the app
Get step-by-step solutions on Sovi AI
Photo-based solutions with guided steps
Explore more problems and detailed explanations
- Outlier at (3,0)
- Strong positive association
- Linear