QUESTION IMAGE
Question
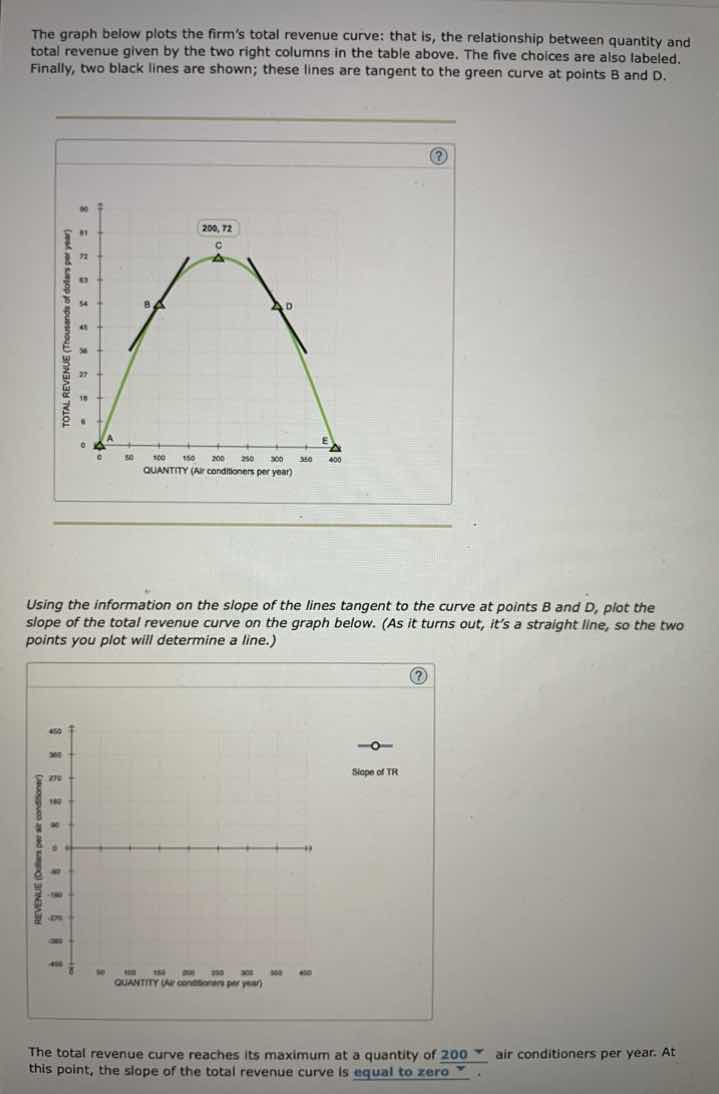
the graph below plots the firm’s total revenue curve: that is, the relationship between quantity and total revenue given by the two right columns in the table above. the five choices are also labeled. finally, two black lines are shown; these lines are tangent to the green curve at points b and d.
using the information on the slope of the lines tangent to the curve at points b and d, plot the slope of the total revenue curve on the graph below. (as it turns out, it’s a straight line, so the two points you plot will determine a line.)
the total revenue curve reaches its maximum at a quantity of 200 air conditioners per year. at this point, the slope of the total revenue curve is equal to zero.
Step1: Define slope of TR
The slope of the total revenue (TR) curve is marginal revenue (MR), calculated as $\text{MR} = \frac{\Delta \text{TR}}{\Delta Q}$.
Step2: Calculate slope at Point B
Assume Point B is at $(100, 48)$ (from curve shape). Point A is $(0,0)$.
Slope: $\frac{48 - 0}{100 - 0} = 0.48$ (in thousands, so $480$).
Step3: Calculate slope at Point D
Assume Point D is at $(300, 48)$. Point E is $(400,0)$.
Slope: $\frac{0 - 48}{400 - 300} = -0.48$ (in thousands, so $-480$).
Step4: Plot the slope line
Plot points $(100, 480)$ and $(300, -480)$; draw a straight line through them. This line will cross the quantity axis at $200$ (where slope = 0, matching the maximum TR point).

Snap & solve any problem in the app
Get step-by-step solutions on Sovi AI
Photo-based solutions with guided steps
Explore more problems and detailed explanations
- On the slope graph, plot the point $(100, 480)$ and $(300, -480)$, then draw a straight line connecting them. This line intersects the quantity axis at $(200, 0)$.
- The completed statements are:
- The total revenue curve reaches its maximum at a quantity of $\boldsymbol{200}$ air conditioners per year.
- At this point, the slope of the total revenue curve is $\boldsymbol{\text{equal to zero}}$.