QUESTION IMAGE
20,513 Learners found this answer helpful
Question
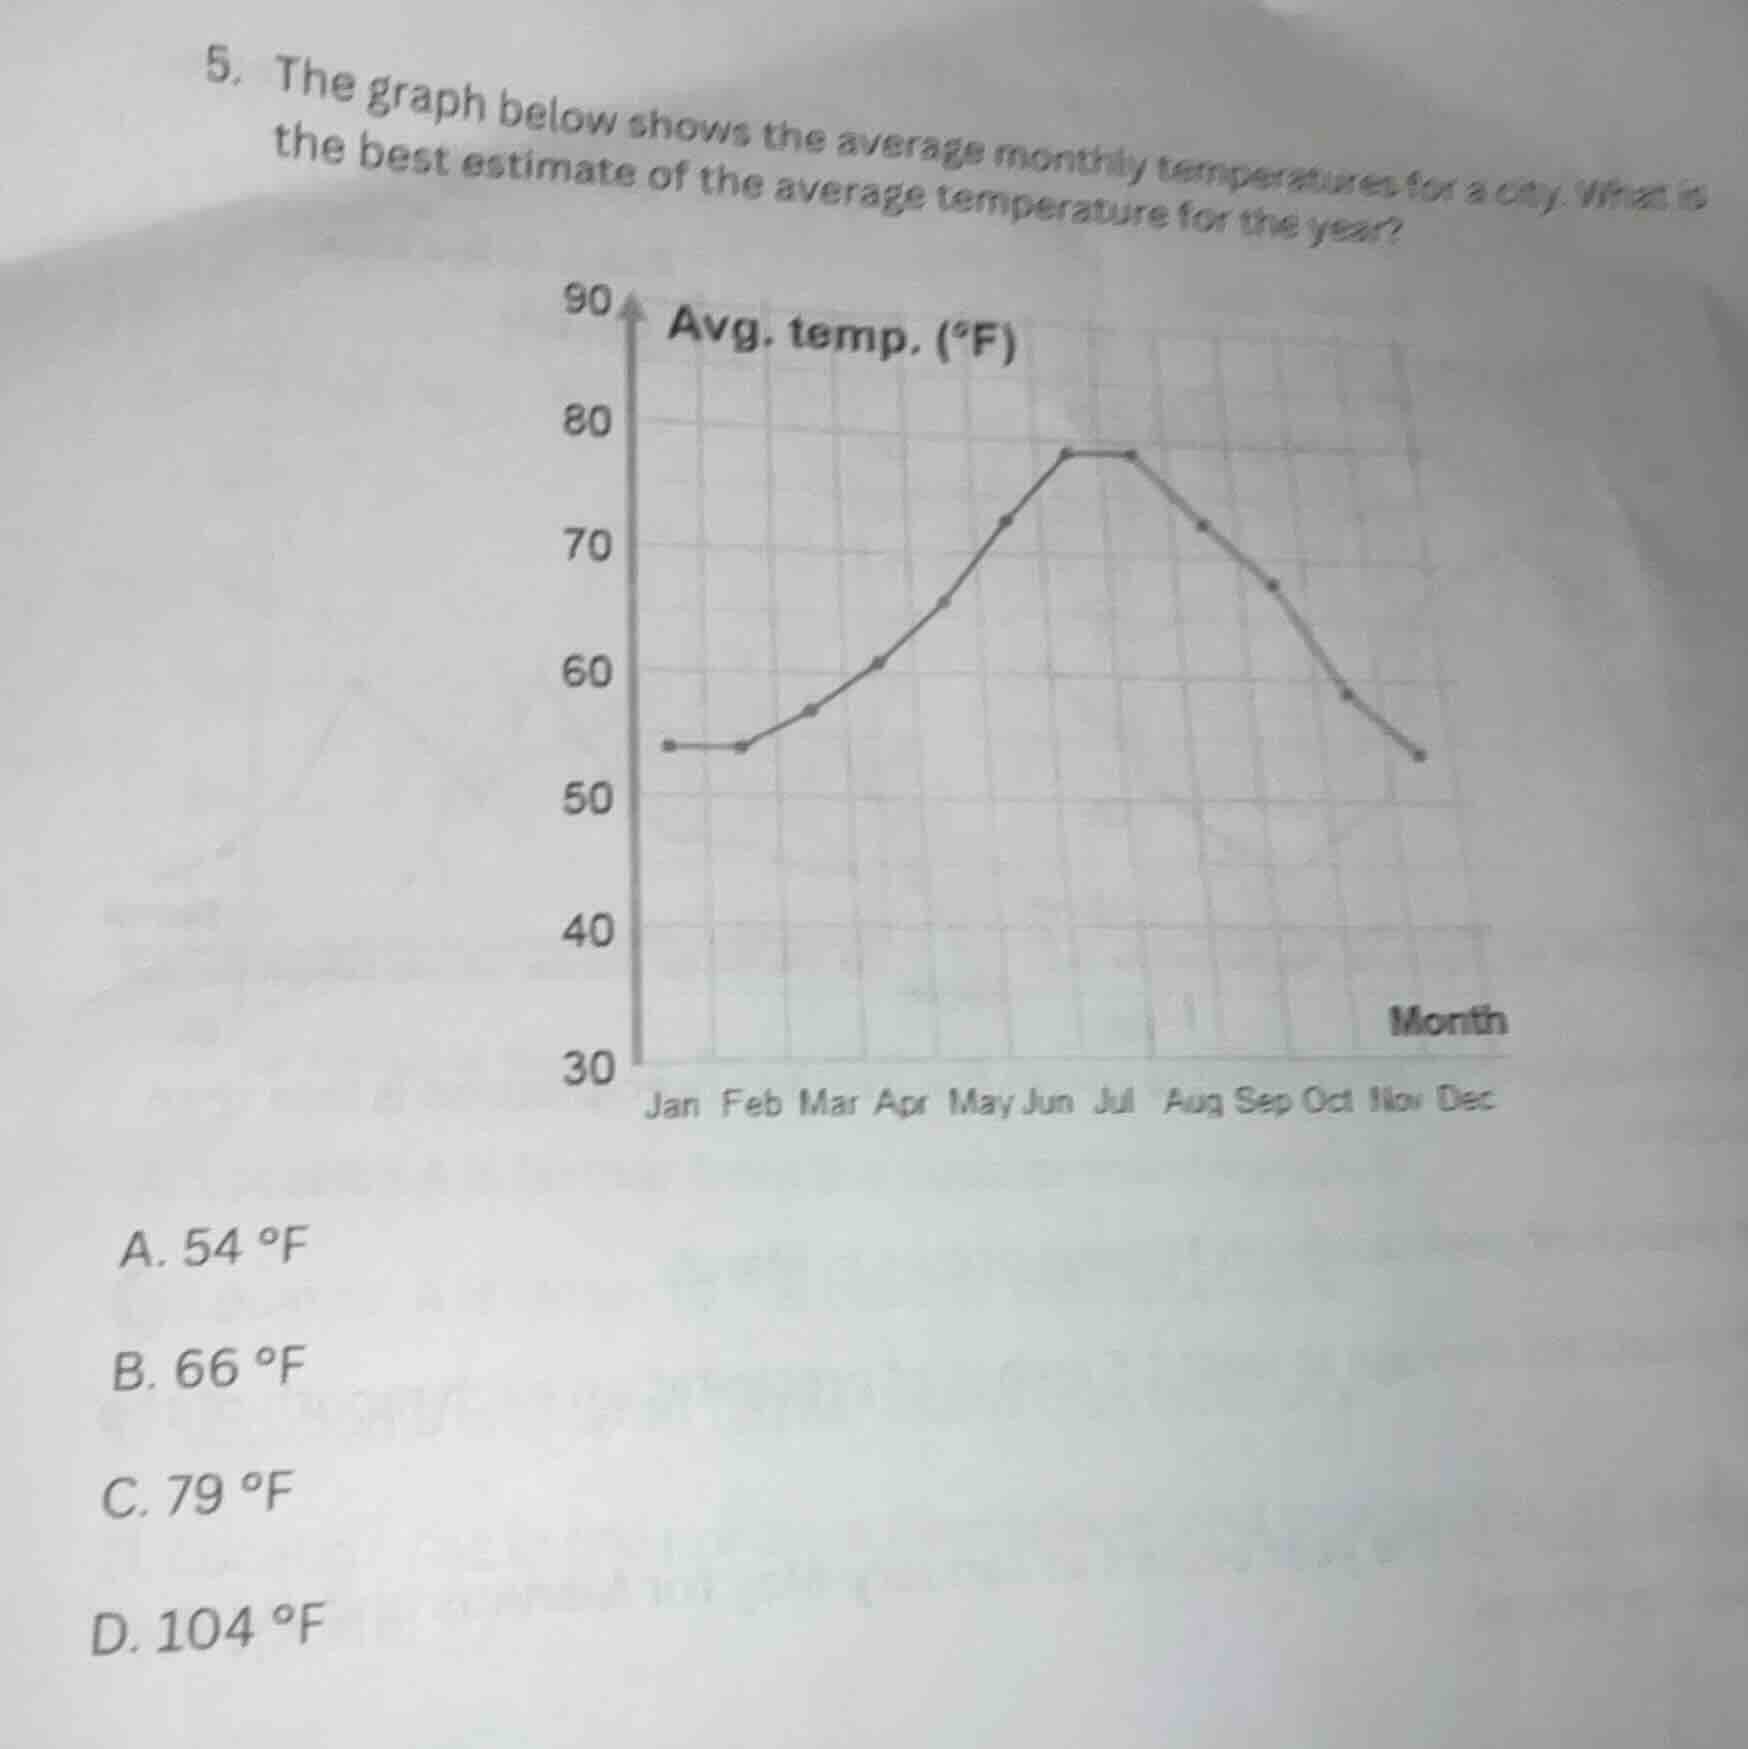
- the graph below shows the average monthly temperatures for a city. what is the best estimate of the average temperature for the year? a. 54 °f b. 66 °f c. 79 °f d. 104 °f
Step1: List monthly temperatures
Jan: $54^\circ\text{F}$, Feb: $54^\circ\text{F}$, Mar: $57^\circ\text{F}$, Apr: $61^\circ\text{F}$, May: $65^\circ\text{F}$, Jun: $72^\circ\text{F}$, Jul: $77^\circ\text{F}$, Aug: $77^\circ\text{F}$, Sep: $71^\circ\text{F}$, Oct: $67^\circ\text{F}$, Nov: $58^\circ\text{F}$, Dec: $53^\circ\text{F}$
Step2: Sum all temperatures
$54+54+57+61+65+72+77+77+71+67+58+53 = 786$
Step3: Calculate yearly average
$\frac{786}{12} = 65.5 \approx 66$

Snap & solve any problem in the app
Get step-by-step solutions on Sovi AI
Photo-based solutions with guided steps
Explore more problems and detailed explanations
B. 66 °F