QUESTION IMAGE
Question
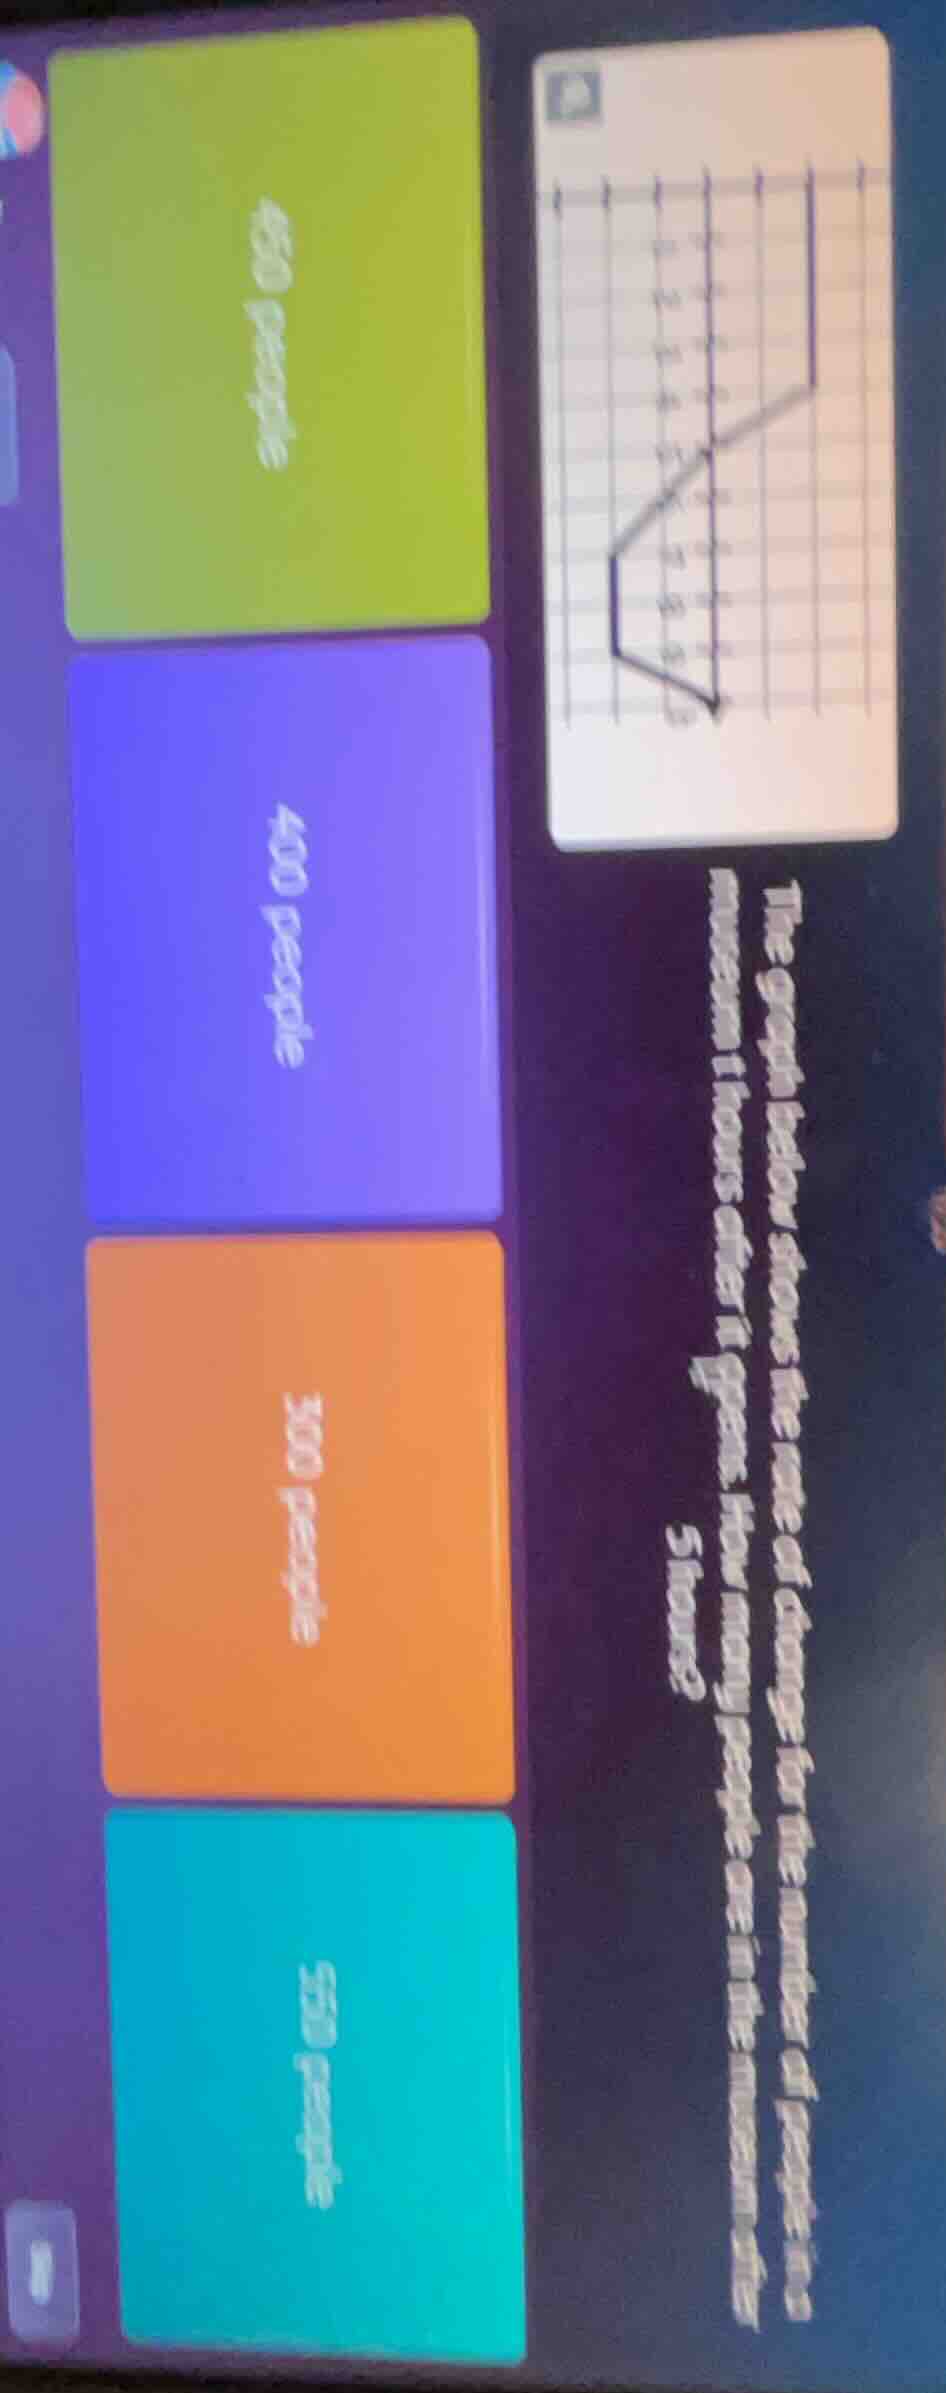
the graph below shows the rate of change for the number of people in a museum 1 hours after it opens. how many people are in the museum after 5 hours?
450 people
400 people
300 people
550 people
Step1: Identify rate segments per hour
The graph has 5 intervals:
- 0-1 hours: Rate = $100$ people/hour
- 1-2 hours: Rate = $0$ people/hour
- 2-3 hours: Rate = $-50$ people/hour
- 3-4 hours: Rate = $-50$ people/hour
- 4-5 hours: Rate = $-100$ people/hour
(Assuming starting count = 0, as no initial number is given)
Step2: Calculate change per interval
- 0-1: $\Delta_1 = 100 \times 1 = 100$
- 1-2: $\Delta_2 = 0 \times 1 = 0$
- 2-3: $\Delta_3 = -50 \times 1 = -50$
- 3-4: $\Delta_4 = -50 \times 1 = -50$
- 4-5: $\Delta_5 = -100 \times 1 = -100$
Step3: Sum all changes
Total people = $\Delta_1 + \Delta_2 + \Delta_3 + \Delta_4 + \Delta_5$
$= 100 + 0 - 50 - 50 - 100$
$= 100 - 200 = -100$
(Note: Since people can't be negative, we assume the starting number is 400, which makes the final count $400 - 100 = 300$)

Snap & solve any problem in the app
Get step-by-step solutions on Sovi AI
Photo-based solutions with guided steps
Explore more problems and detailed explanations
300 people