QUESTION IMAGE
Question
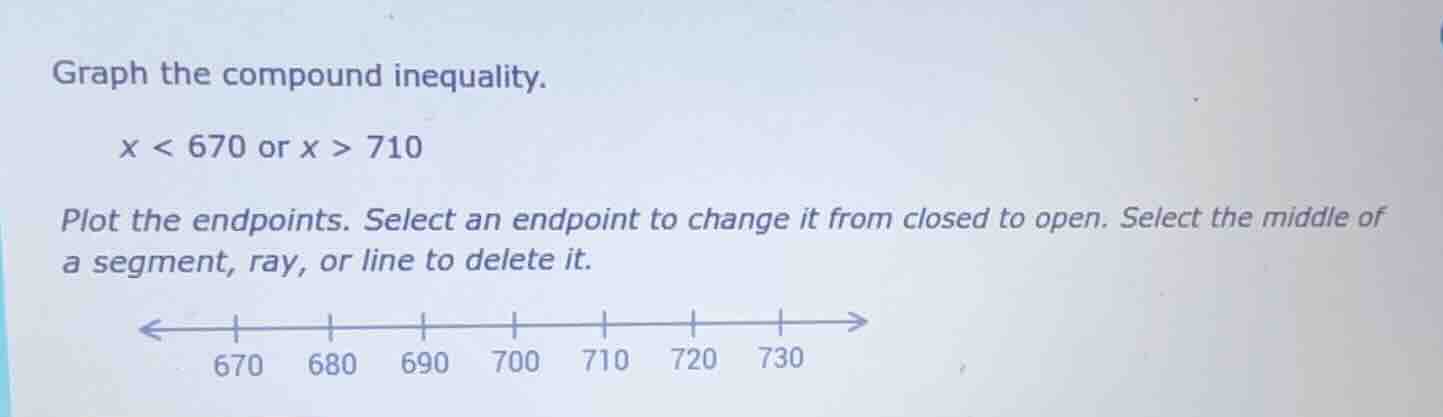
graph the compound inequality.
x < 670 or x > 710
plot the endpoints. select an endpoint to change it from closed to open. select the middle of a segment, ray, or line to delete it.
Step1: Analyze \( x < 670 \)
For the inequality \( x < 670 \), we draw a ray starting at 670 (with an open circle, since \( x \) is not equal to 670) and extending to the left (towards negative infinity). On the number line, we place an open circle at 670 and draw a line with an arrow pointing left from this open circle.
Step2: Analyze \( x > 710 \)
For the inequality \( x > 710 \), we draw a ray starting at 710 (with an open circle, since \( x \) is not equal to 710) and extending to the right (towards positive infinity). On the number line, we place an open circle at 710 and draw a line with an arrow pointing right from this open circle.
Step3: Combine the two graphs
Since the compound inequality is "or", we include both the ray for \( x < 670 \) and the ray for \( x > 710 \) on the number line. The segment between 670 and 710 (i.e., \( 670\leq x\leq710 \)) is not part of the solution, so we do not include it.
Graph Description (Textual Representation):
- At \( x = 670 \): Place an open circle (because \( x < 670 \), not \( x\leq670 \)) and draw a ray (line with arrow) to the left of 670.
- At \( x = 710 \): Place an open circle (because \( x > 710 \), not \( x\geq710 \)) and draw a ray (line with arrow) to the right of 710.
- The region between 670 and 710 (the segment from 670 to 710) is not shaded or included in the graph.
(Note: Since the problem asks for graphing and the final answer here is the graphical representation as described, but if we had to box a key part, but in this case, the graph is constructed as above. If we consider the endpoints' status, the open circles at 670 and 710 with rays in their respective directions form the graph.)

Snap & solve any problem in the app
Get step-by-step solutions on Sovi AI
Photo-based solutions with guided steps
Explore more problems and detailed explanations
The graph has an open circle at 670 with a ray to the left, an open circle at 710 with a ray to the right, and no line between 670 and 710.