QUESTION IMAGE
Question
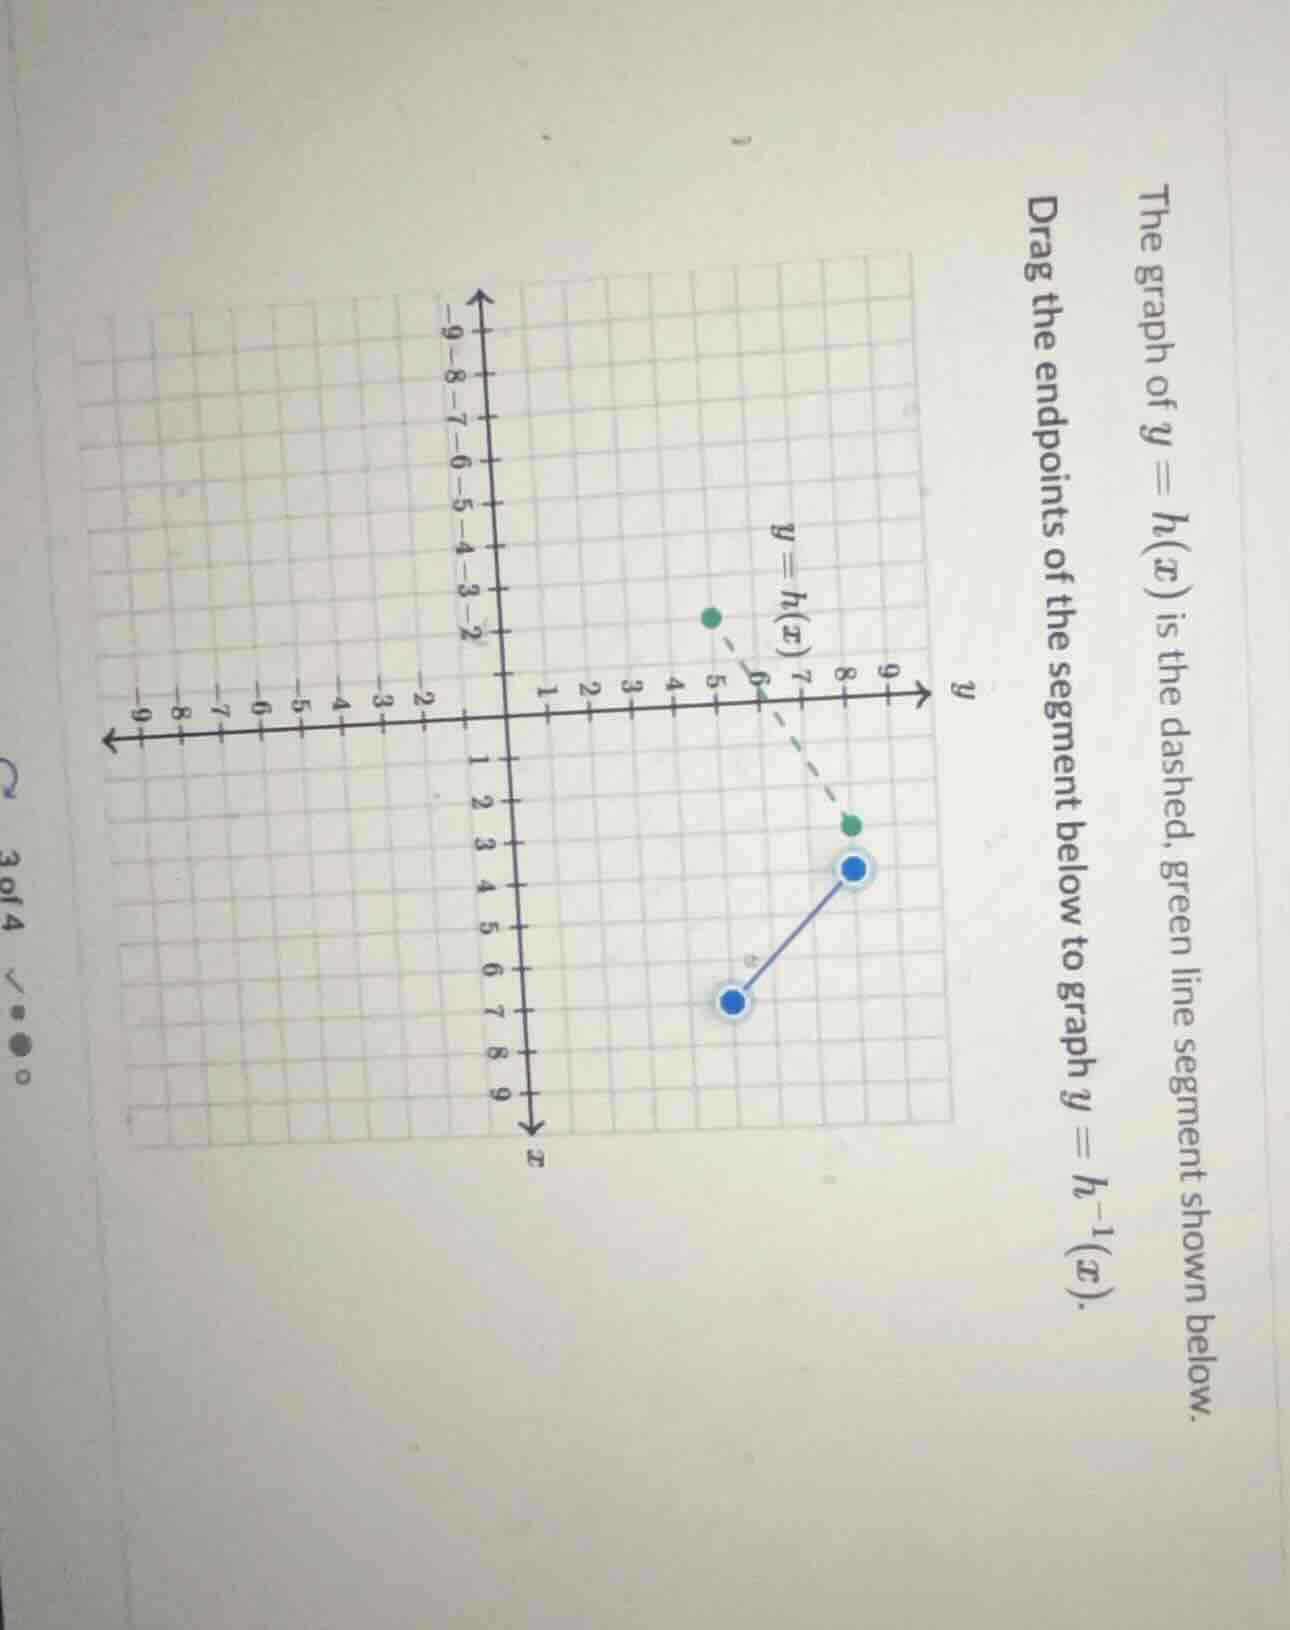
the graph of ( y = h(x) ) is the dashed, green line segment shown below. drag the endpoints of the segment below to graph ( y = h^{-1}(x) ).
Step1: Identify endpoints of $h(x)$
The dashed green segment $y=h(x)$ has endpoints: $(x_1,y_1)=(4,2)$ and $(x_2,y_2)=(7,5)$
Step2: Swap $x,y$ for inverse function
For an inverse function $h^{-1}(x)$, the endpoints are the swapped pairs of $h(x)$: $(y_1,x_1)=(2,4)$ and $(y_2,x_2)=(5,7)$

Snap & solve any problem in the app
Get step-by-step solutions on Sovi AI
Photo-based solutions with guided steps
Explore more problems and detailed explanations
The endpoints of $y=h^{-1}(x)$ are $(2,4)$ and $(5,7)$ (these are the points to plot on the grid by dragging the segments to these coordinates).