QUESTION IMAGE
Question
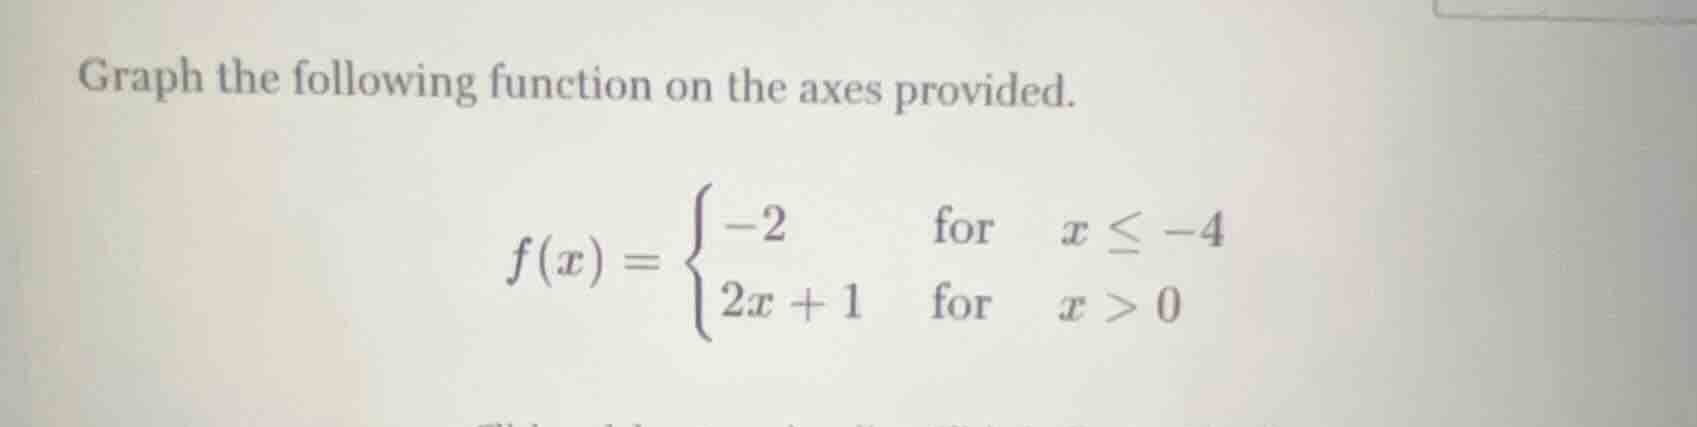
graph the following function on the axes provided.
$f(x) = \
$
Step1: Analyze the first piece
The first piece of the function is \( f(x) = -2 \) for \( x \leq -4 \). This is a horizontal line. To graph it, we note that for all \( x \) values less than or equal to -4, the \( y \)-value is -2. So we plot a horizontal line starting from \( x = -\infty \) up to \( x = -4 \), with a closed dot at \( x = -4 \) (since the inequality is \( x \leq -4 \)) and \( y = -2 \).
Step2: Analyze the second piece
The second piece is \( f(x) = 2x + 1 \) for \( x > 0 \). This is a linear function. To graph it, we can find two points. When \( x = 0 \), the function is not defined here (since \( x > 0 \)), but we can find the value as \( x \) approaches 0 from the right. Plugging \( x = 0 \) into \( 2x + 1 \), we get \( 2(0) + 1 = 1 \), so we have an open dot at \( (0, 1) \). Then, we can find another point, say \( x = 1 \), then \( f(1) = 2(1) + 1 = 3 \), so the point \( (1, 3) \). We draw a line with a slope of 2 passing through these points (starting from the open dot at \( (0, 1) \) and going to the right).
(Note: Since the problem is to graph the function, the above steps describe how to construct the graph. If a visual graph was to be drawn, it would consist of a horizontal line segment at \( y = -2 \) for \( x \leq -4 \) and a line with slope 2 starting at an open dot at \( (0, 1) \) and extending to the right for \( x > 0 \).)

Snap & solve any problem in the app
Get step-by-step solutions on Sovi AI
Photo-based solutions with guided steps
Explore more problems and detailed explanations
The graph consists of a horizontal line \( y = -2 \) for \( x \leq -4 \) (with a closed dot at \( (-4, -2) \)) and a line \( y = 2x + 1 \) for \( x > 0 \) (with an open dot at \( (0, 1) \) and passing through points like \( (1, 3) \), \( (2, 5) \), etc.).