QUESTION IMAGE
Question
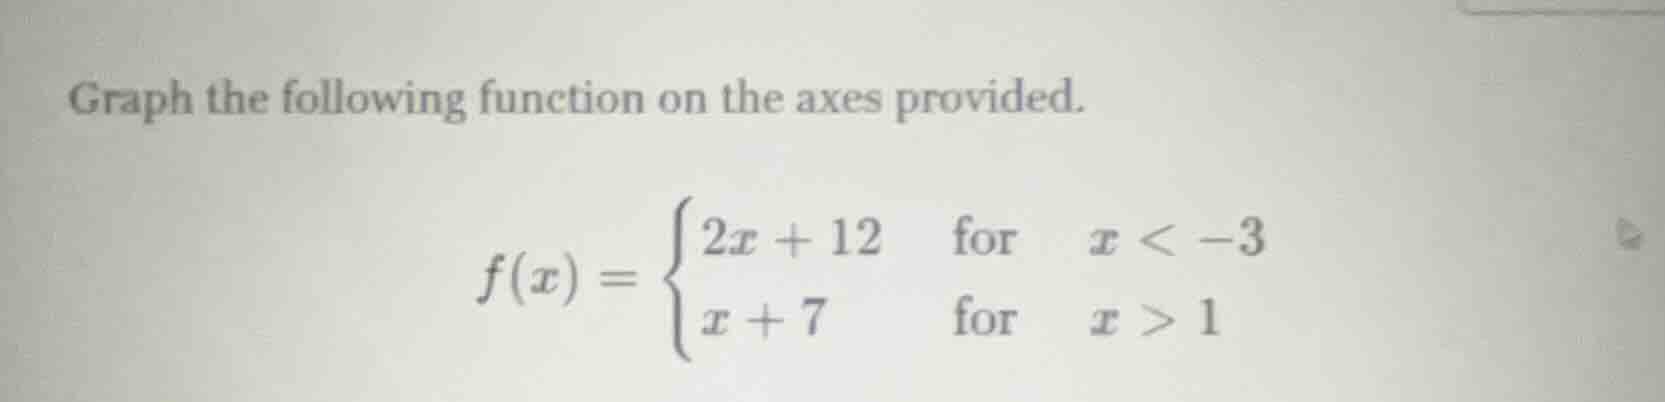
graph the following function on the axes provided.
$f(x) = \
$
Step1: Analyze the first piece \(2x + 12\) (\(x < -3\))
This is a linear function with slope \(m = 2\) and y - intercept \(b = 12\). But since \(x < - 3\), we find the value at \(x=-3\) (even though it's not included) to get a point. When \(x=-3\), \(y = 2\times(-3)+12=-6 + 12 = 6\). We draw a line with slope 2, starting from the left, and for \(x < -3\), the line will have an open circle at \(x=-3\) (because \(x=-3\) is not in the domain of this piece) and go towards the left. We can also find another point, for example, when \(x=-4\), \(y=2\times(-4)+12=-8 + 12 = 4\). So we have two points \((-4,4)\) and the open circle at \((-3,6)\) for the first piece.
Step2: Analyze the second piece \(x + 7\) (\(x>1\))
This is a linear function with slope \(m = 1\) and y - intercept \(b = 7\). We find the value at \(x = 1\) (not included) to get a point. When \(x=1\), \(y=1 + 7=8\). We draw a line with slope 1, starting from the right of \(x = 1\). We can find another point, for example, when \(x=2\), \(y=2 + 7 = 9\). So we have an open circle at \((1,8)\) and the point \((2,9)\) for the second piece.
To graph the function:
- For the first part \(y = 2x+12, x < - 3\):
- Plot the open circle at \((-3,6)\) (since \(x=-3\) is not in the domain of this sub - function).
- Use the slope \(m = 2\) (rise 2, run 1) to plot other points for \(x < - 3\). For example, from \((-3,6)\) (open circle), moving left 1 unit (to \(x=-4\)) and down 2 units (since slope is 2, but for \(x\) decreasing, the change in \(y\) is negative when \(x\) decreases) gives \((-4,4)\) as we calculated before. Draw a line through these points for \(x < - 3\).
- For the second part \(y=x + 7, x>1\):
- Plot the open circle at \((1,8)\) (since \(x = 1\) is not in the domain of this sub - function).
- Use the slope \(m = 1\) (rise 1, run 1) to plot other points for \(x>1\). For example, from \((1,8)\) (open circle), moving right 1 unit (to \(x = 2\)) and up 1 unit gives \((2,9)\). Draw a line through these points for \(x>1\).
(Note: Since the problem is about graphing, the final answer is the graphical representation as described above. If we were to describe the key features: The first part is a line with slope 2, left of \(x=-3\) with an open circle at \((-3,6)\). The second part is a line with slope 1, right of \(x = 1\) with an open circle at \((1,8)\).)

Snap & solve any problem in the app
Get step-by-step solutions on Sovi AI
Photo-based solutions with guided steps
Explore more problems and detailed explanations
The function \(f(x)\) consists of two linear pieces:
- For \(x < - 3\), the line \(y=2x + 12\) with an open circle at \((-3,6)\) and passing through points like \((-4,4)\).
- For \(x>1\), the line \(y=x + 7\) with an open circle at \((1,8)\) and passing through points like \((2,9)\). The graph is constructed by plotting these lines with the appropriate open circles and using the slopes to draw the lines for their respective domains.