QUESTION IMAGE
Question
graph a
graph b
graph c
graph d
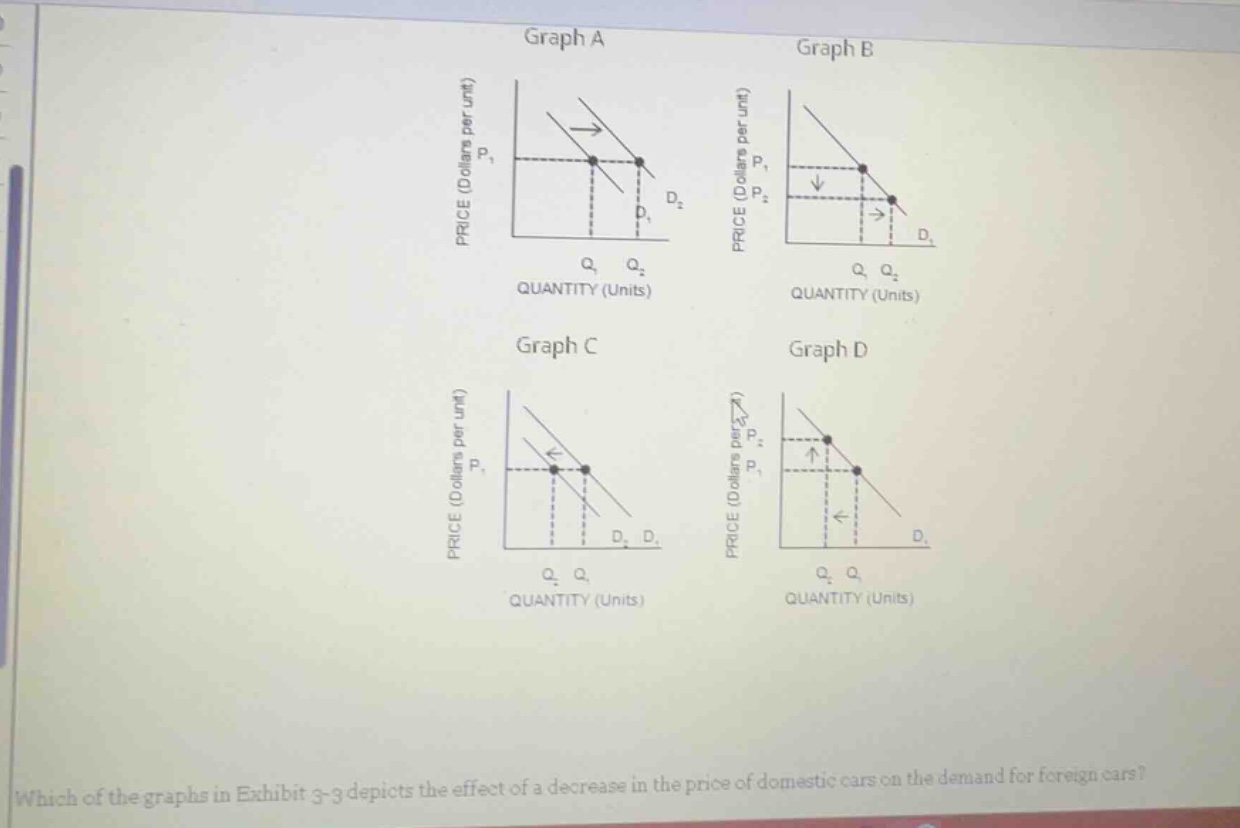
which of the graphs in exhibit 3 - 3 depicts the effect of a decrease in the price of domestic cars on the demand for foreign cars?
Domestic cars and foreign cars are substitute goods. When the price of domestic cars decreases, consumers will shift demand from foreign cars to domestic cars, causing a leftward shift in the demand curve for foreign cars (decrease in demand, not quantity demanded). This means at every price level, the quantity demanded of foreign cars is lower, which matches Graph C: the demand curve moves left from $D_1$ to $D_2$, leading to lower quantity $Q_2$ at the same price $P_1$.

Snap & solve any problem in the app
Get step-by-step solutions on Sovi AI
Photo-based solutions with guided steps
Explore more problems and detailed explanations
Graph C