QUESTION IMAGE
Question
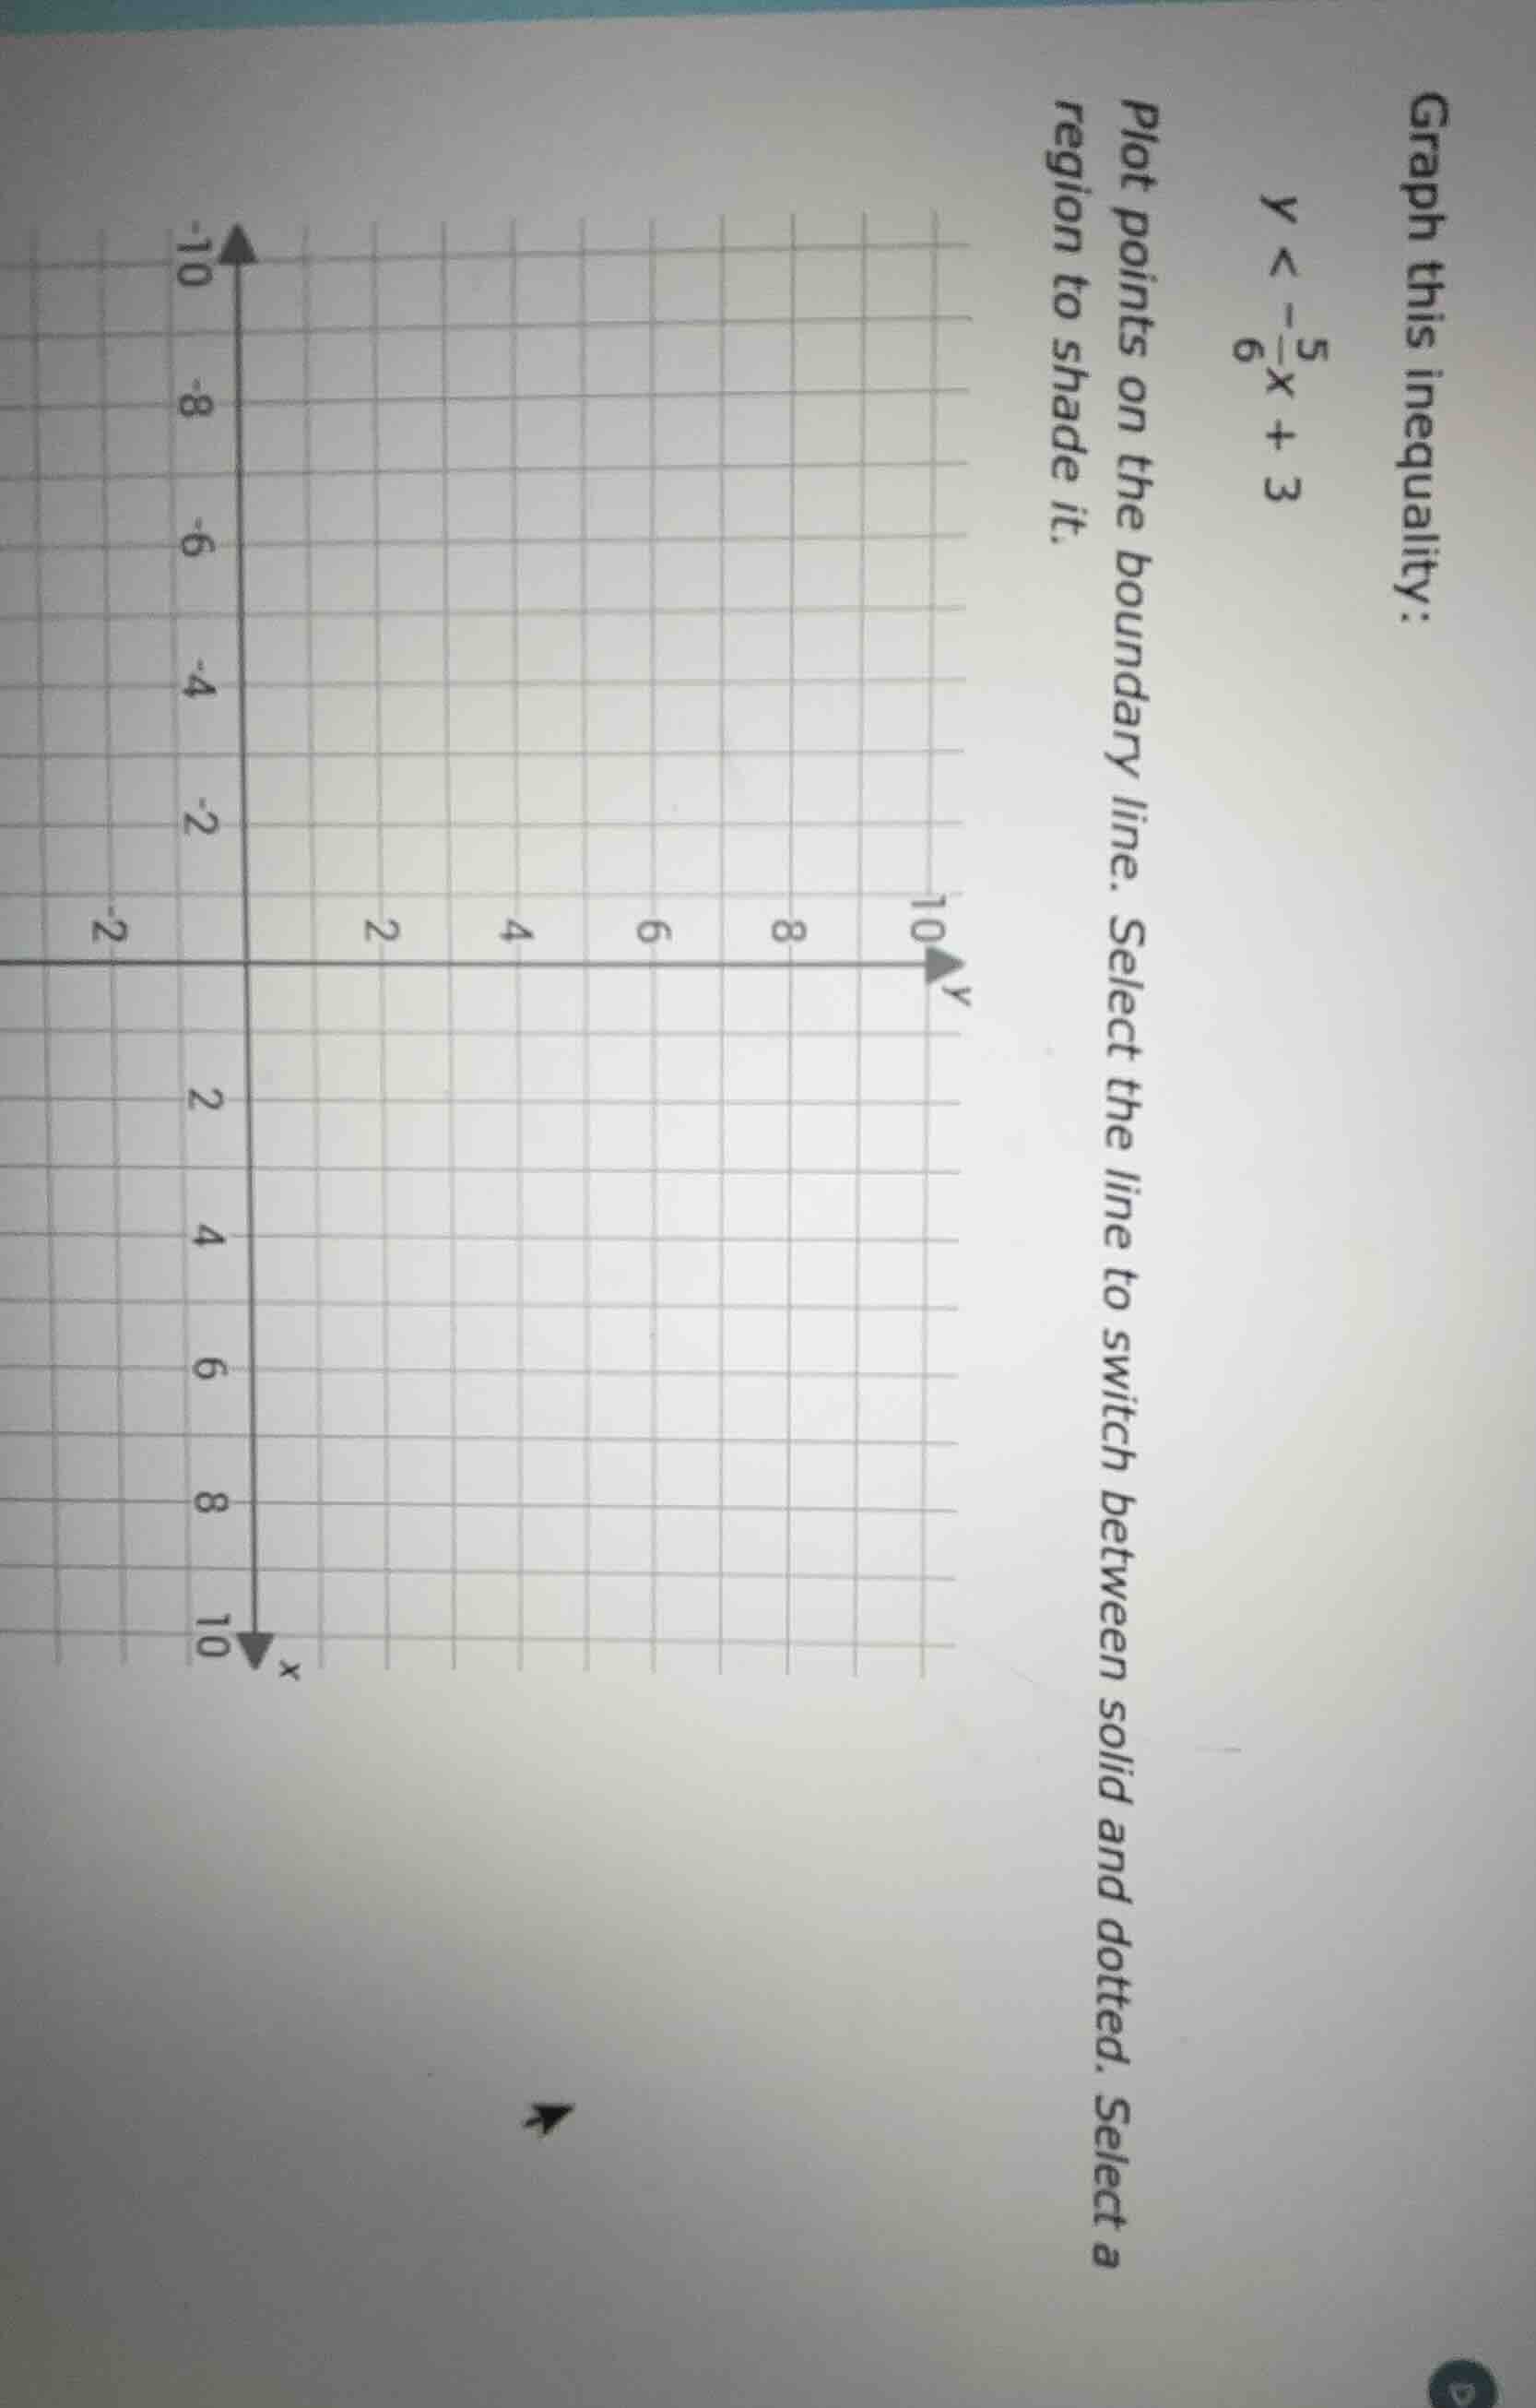
graph this inequality:
$y < -\frac{5}{6}x + 3$
plot points on the boundary line. select the line to switch between solid and dotted. select a region to shade it.
Step1: Identify boundary line type
Since the inequality is $y < -\frac{5}{6}x + 3$ (strict inequality, no equal sign), the boundary line is dotted.
Step2: Find y-intercept of boundary
The equation is in slope-intercept form $y=mx+b$, where $b=3$. So the y-intercept is $(0, 3)$.
Step3: Find second point using slope
Slope $m=-\frac{5}{6}$, meaning $\frac{\Delta y}{\Delta x}=-\frac{5}{6}$. From $(0,3)$, move 6 units right and 5 units down: $(0+6, 3-5)=(6, -2)$.
Step4: Test a point to find shaded region
Use the origin $(0,0)$: substitute into $y < -\frac{5}{6}x + 3$:
$0 < -\frac{5}{6}(0) + 3$ → $0 < 3$, which is true. So shade the region containing $(0,0)$ (below the dotted line).

Snap & solve any problem in the app
Get step-by-step solutions on Sovi AI
Photo-based solutions with guided steps
Explore more problems and detailed explanations
- Draw a dotted line connecting the points $(0, 3)$ and $(6, -2)$.
- Shade the entire region below this dotted line.