QUESTION IMAGE
Question
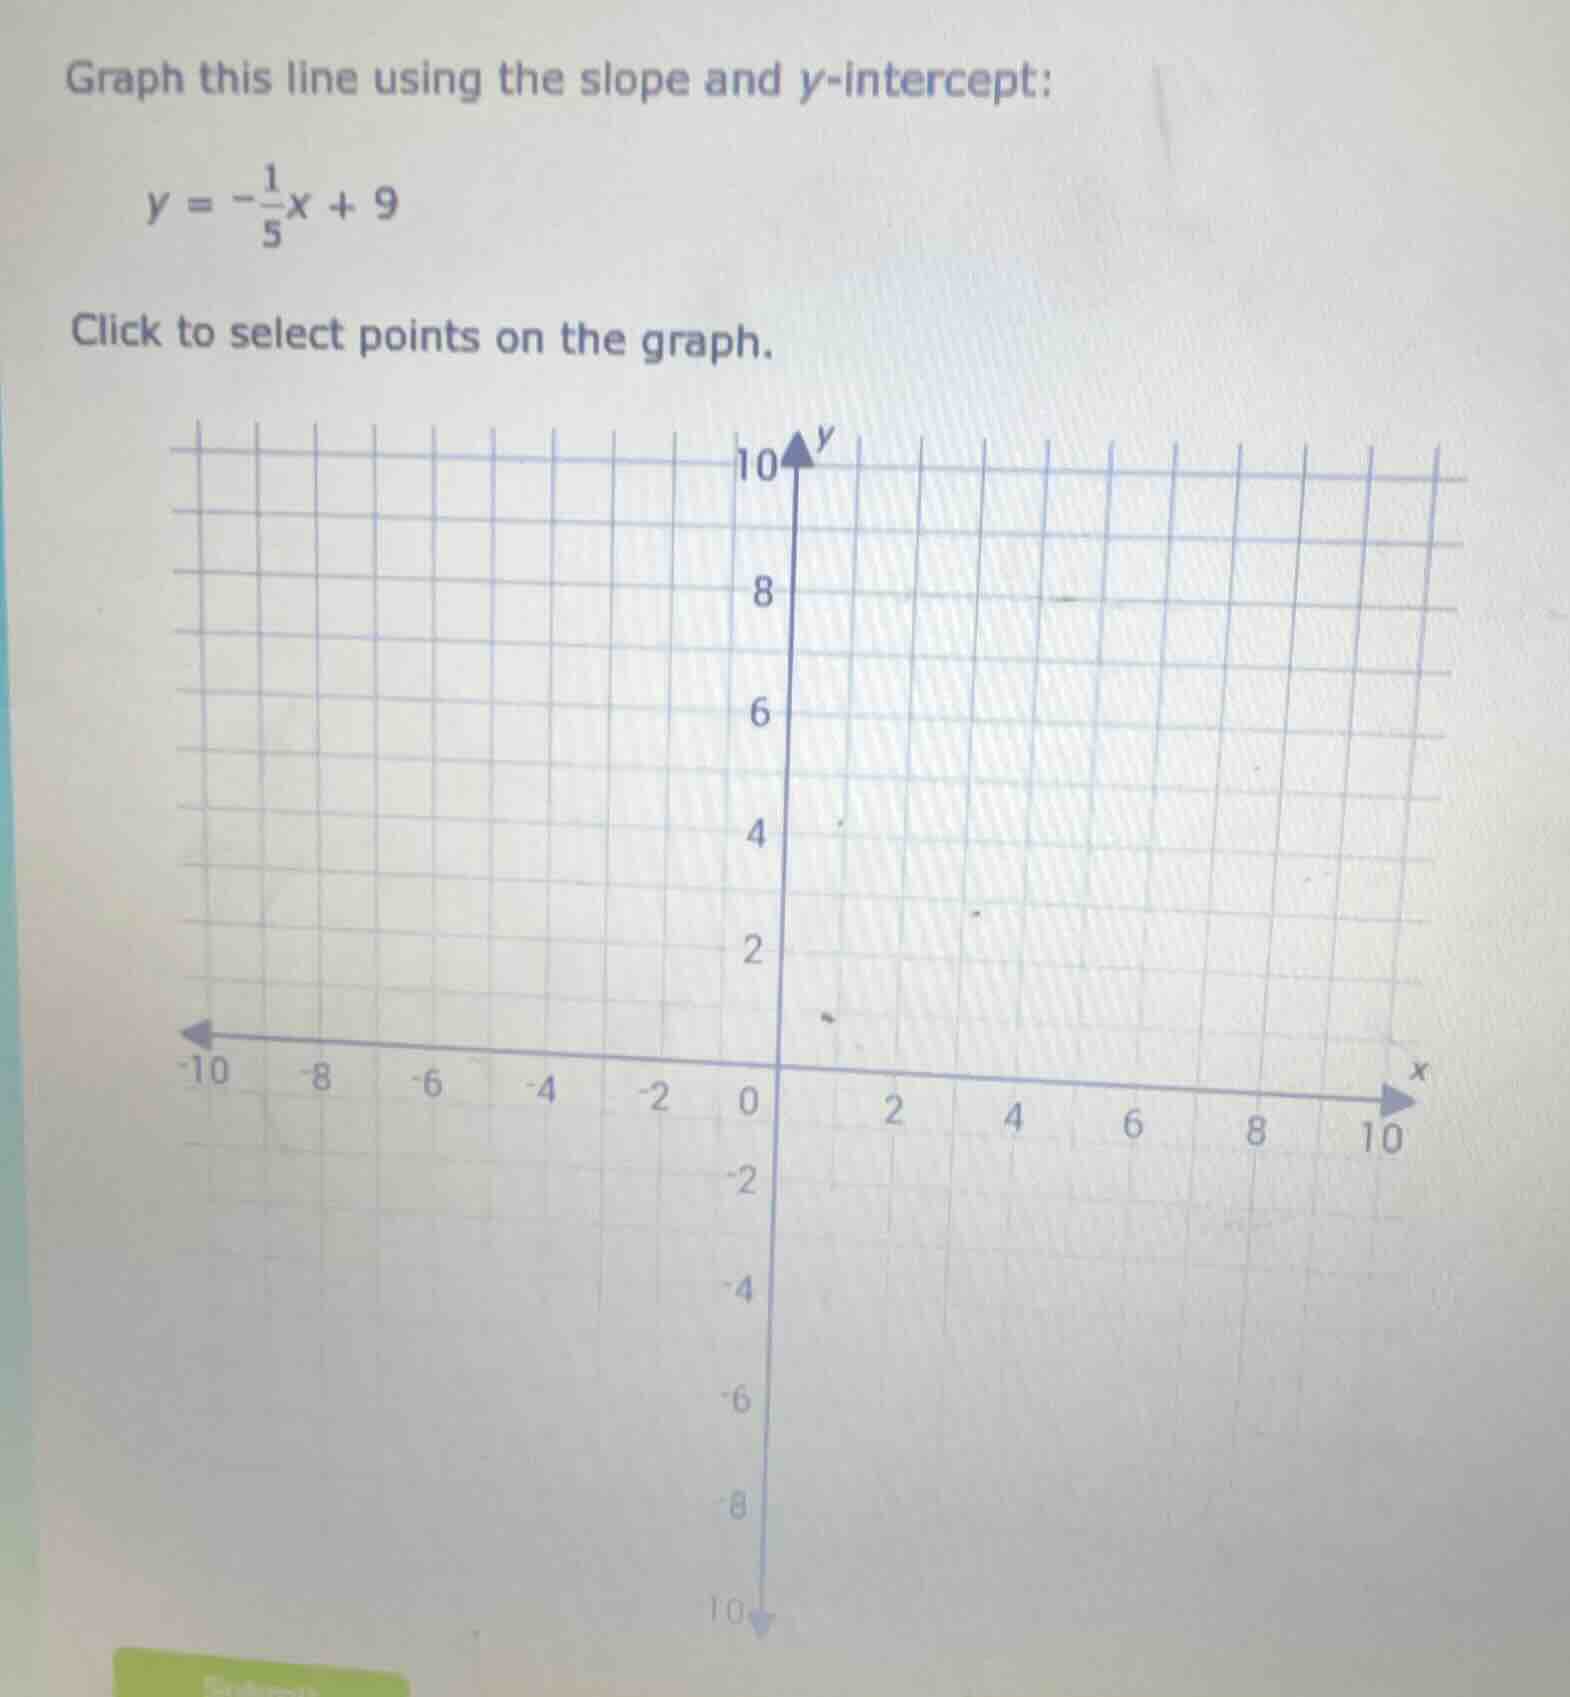
graph this line using the slope and y-intercept:
$y = -\frac{1}{5}x + 9$
click to select points on the graph.
(there is a coordinate grid with x-axis from -10 to 10 and y-axis from -10 to 10)
Step1: Identify y-intercept
The equation is in slope - intercept form \(y = mx + b\), where \(b\) is the y - intercept. For \(y=-\frac{1}{5}x + 9\), the y - intercept \(b = 9\). So the line crosses the y - axis at the point \((0,9)\).
Step2: Use slope to find another point
The slope \(m=-\frac{1}{5}\), which can be written as \(\frac{\text{rise}}{\text{run}}=\frac{- 1}{5}\). Starting from the y - intercept \((0,9)\), we move down 1 unit (because the rise is - 1) and then 5 units to the right (because the run is 5). So we get the point \((0 + 5,9-1)=(5,8)\). We can also move up 1 unit and 5 units to the left: \((0 - 5,9 + 1)=(-5,10)\).
Step3: Graph the line
Plot the points \((0,9)\), \((5,8)\) (or \((-5,10)\)) and draw a straight line through them.
(Note: Since the problem asks to graph the line, the key points to plot are \((0,9)\) and other points found using the slope. If we were to describe the graph, the line has a y - intercept at 9 and a negative slope, decreasing from left to right with a slope of \(-\frac{1}{5}\).)

Snap & solve any problem in the app
Get step-by-step solutions on Sovi AI
Photo-based solutions with guided steps
Explore more problems and detailed explanations
To graph \(y =-\frac{1}{5}x + 9\):
- Plot the y - intercept: \((0,9)\) (where the line crosses the y - axis).
- Use the slope \(m =-\frac{1}{5}\): From \((0,9)\), move down 1 unit and 5 units right to get \((5,8)\), or up 1 unit and 5 units left to get \((-5,10)\).
- Draw a straight line through the plotted points.