QUESTION IMAGE
Question
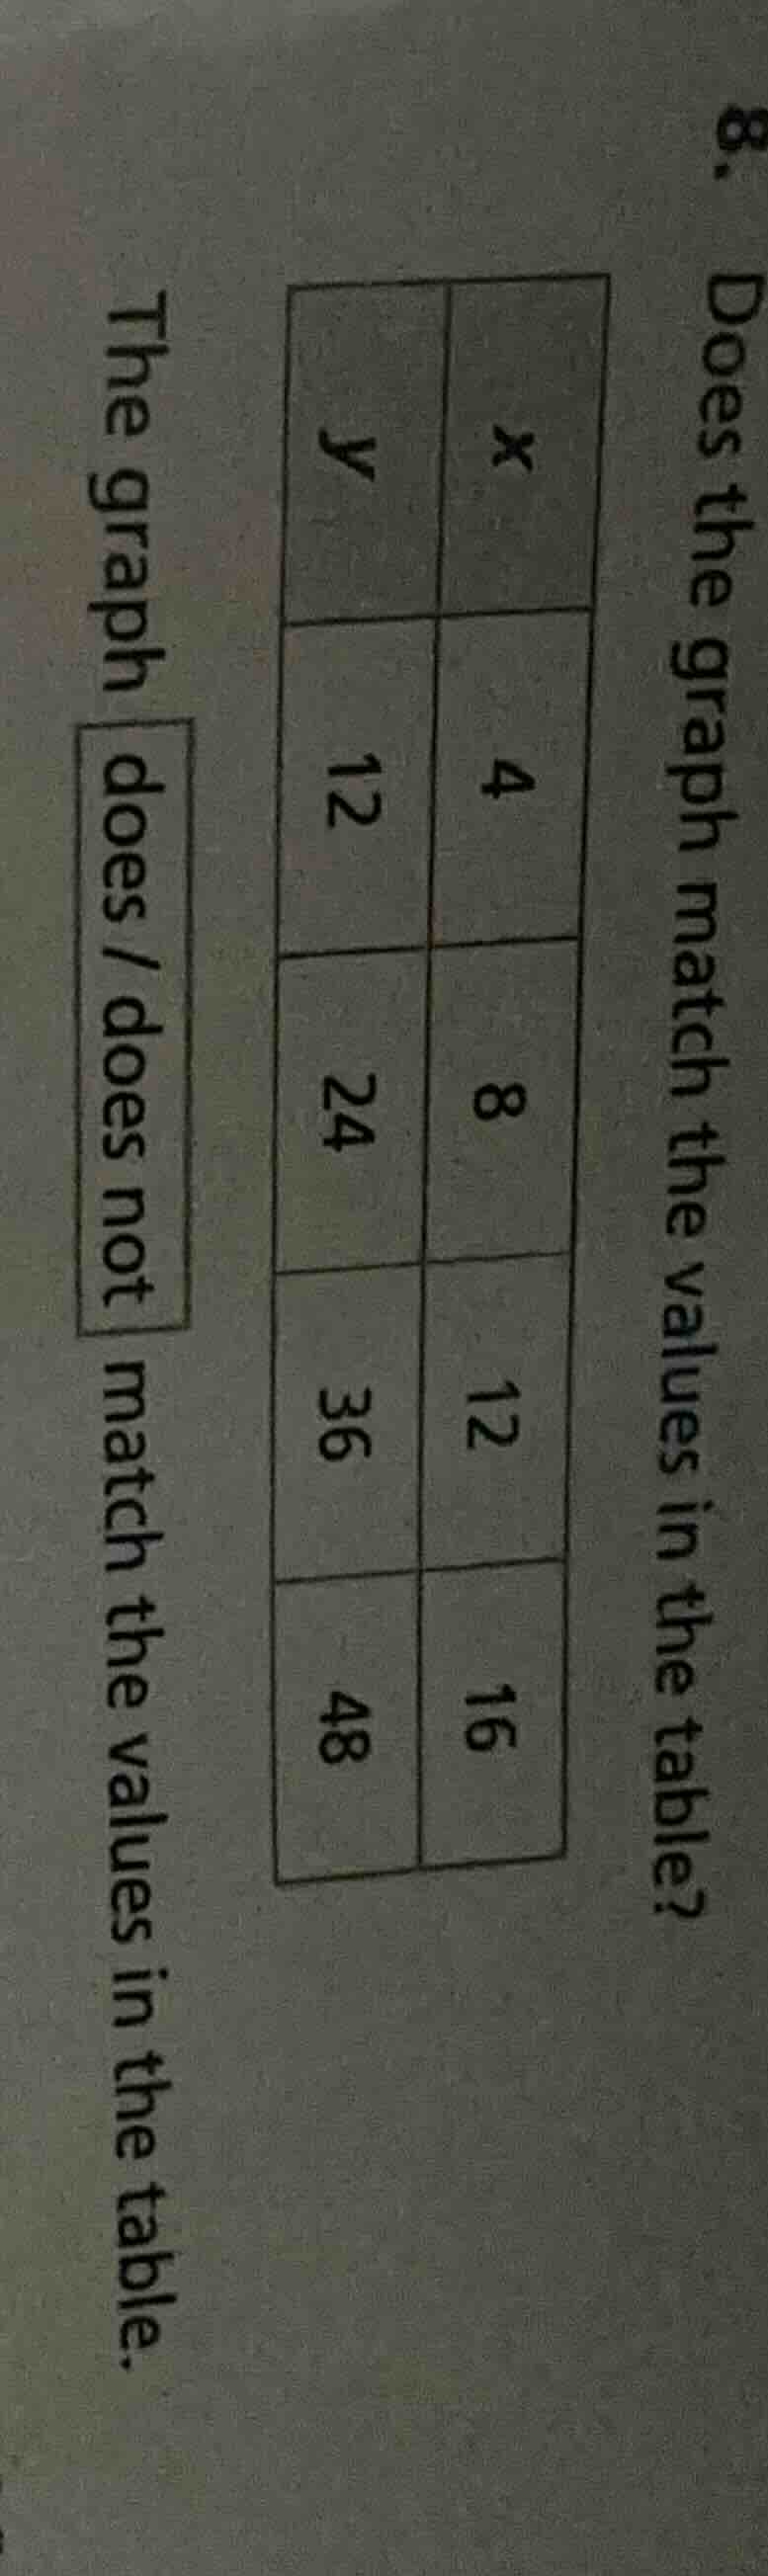
- does the graph match the values in the table?
| x | y |
|---|---|
| 8 | 24 |
| 12 | 36 |
| 16 | 48 |
the graph does/does not match the values in the table.
Step1: Check the ratio of \( y \) to \( x \) for each pair
For the first pair (\( x = 4, y = 12 \)): \(\frac{y}{x}=\frac{12}{4} = 3\)
Step2: Check the second pair (\( x = 8, y = 24 \))
\(\frac{y}{x}=\frac{24}{8}=3\)
Step3: Check the third pair (\( x = 12, y = 36 \))
\(\frac{y}{x}=\frac{36}{12}=3\)
Step4: Check the fourth pair (\( x = 16, y = 48 \))
\(\frac{y}{x}=\frac{48}{16}=3\)
Since the ratio \(\frac{y}{x}\) is constant (equal to 3) for all pairs, the relationship is proportional, and if the graph represents a proportional relationship with this constant ratio, it should match. But wait, let's re - evaluate. Wait, actually, when we check the last pair: \(x = 16\), \(y = 48\), \(\frac{48}{16}=3\), the first three pairs also have a ratio of 3. But wait, maybe there is a miscalculation? Wait no, \(12\div4 = 3\), \(24\div8 = 3\), \(36\div12 = 3\), \(48\div16 = 3\). So the ratio is constant. But the problem is asking "Does the graph match the values in the table?". Wait, maybe I misread. Wait, let's check the last pair again. Wait, \(x = 16\), \(y = 48\): \(48\div16 = 3\). The first three: \(12\div4 = 3\), \(24\div8 = 3\), \(36\div12 = 3\). So the relationship is \(y = 3x\). So if the graph is of \(y = 3x\), it should match. But wait, maybe the original problem has a typo? Wait no, according to the calculations, the ratio is constant. But wait, maybe I made a mistake. Wait, no, all the ratios are 3. So the graph (if it's a straight line through the origin with slope 3) should match. But the option is "does/does not". Wait, wait, let's re - check the last pair. Wait, \(x = 16\), \(y = 48\): \(48\div16 = 3\). The first three: \(12\div4 = 3\), \(24\div8 = 3\), \(36\div12 = 3\). So the answer should be "does" because the ratio is constant, meaning it's a proportional relationship and the graph (if it's a proportional graph) should match. But wait, maybe the user's table has a mistake? No, according to the given table, all ratios are 3. So the graph does match.
Wait, but maybe I misread the table. Let me check again. The table is:
| \( x \) | \( y \) |
|---|---|
| 8 | 24 |
| 12 | 36 |
| 16 | 48 |
Calculating \( y/x \) for each:
- \( 12/4 = 3 \)
- \( 24/8 = 3 \)
- \( 36/12 = 3 \)
- \( 48/16 = 3 \)
Since the ratio is constant, the graph (representing a proportional relationship \( y = 3x \)) should match the values in the table.

Snap & solve any problem in the app
Get step-by-step solutions on Sovi AI
Photo-based solutions with guided steps
Explore more problems and detailed explanations
does