QUESTION IMAGE
Question
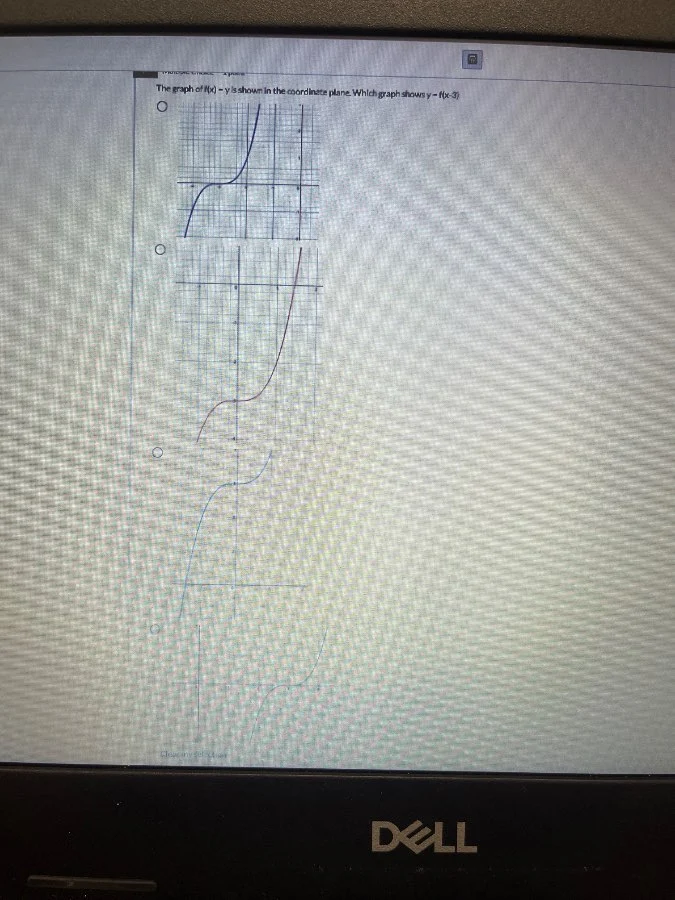
the graph of $f(x)-y$ is shown in the coordinate plane. which graph shows $y=f(x-3)$
Step1: Identify function transformation
The transformation \(y = f(x-3)\) is a horizontal shift of the original graph \(y=f(x)\). For a function \(f(x-h)\), the graph shifts right by \(h\) units. Here, \(h=3\), so we shift every point on \(f(x)\) 3 units to the right.
Step2: Match shifted graph to options
Compare the original blue graph's key features (like the inflection point, start/end behavior) shifted right 3 units to the given options. The correct graph will have all the same shape as \(f(x)\), but each x-coordinate of its points is 3 greater than the original.

Snap & solve any problem in the app
Get step-by-step solutions on Sovi AI
Photo-based solutions with guided steps
Explore more problems and detailed explanations
The third option (the bottom-most blue graph, shifted 3 units right from the original) is the correct graph for \(y = f(x-3)\).