QUESTION IMAGE
Question
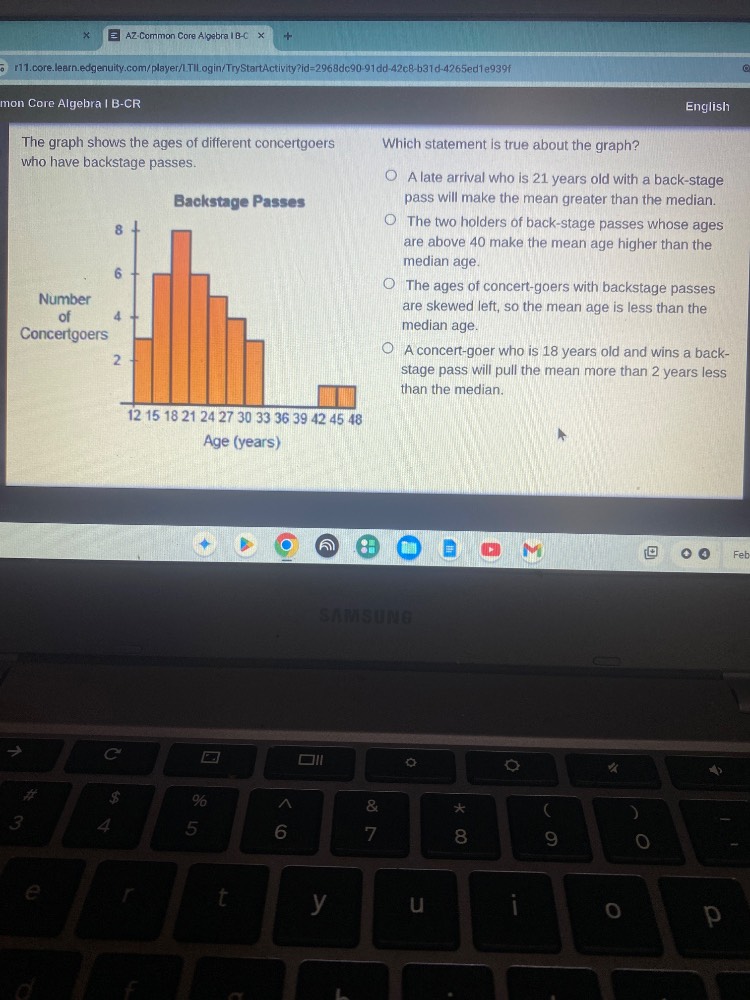
the graph shows the ages of different concertgoers who have backstage passes.
backstage passes
which statement is true about the graph?
○ a late arrival who is 21 years old with a back-stage pass will make the mean greater than the median.
○ the two holders of back-stage passes whose ages are above 40 make the mean age higher than the median age.
○ the ages of concert-goers with backstage passes are skewed left, so the mean age is less than the median age.
○ a concert-goer who is 18 years old and wins a back-stage pass will pull the mean more than 2 years less than the median.
Step1: Calculate total concertgoers
Add frequencies: $3+6+8+6+5+3+2=33$
Step2: Find median position
Median is $\frac{33+1}{2}=17$th value, in 21-24 age group.
Step3: Analyze skew and mean/median
Graph is right-skewed (tail right). For right skew, mean > median.
Step4: Evaluate each option
- 21yo is in median group: won't make mean > median.
- Two 40+ are outliers: pull mean up, so mean > median.
- Skew is right, not left: mean > median.
- 18yo is close to median: won't pull mean 2+ below median.

Snap & solve any problem in the app
Get step-by-step solutions on Sovi AI
Photo-based solutions with guided steps
Explore more problems and detailed explanations
The two holders of back-stage passes whose ages are above 40 make the mean age higher than the median age.