QUESTION IMAGE
Question
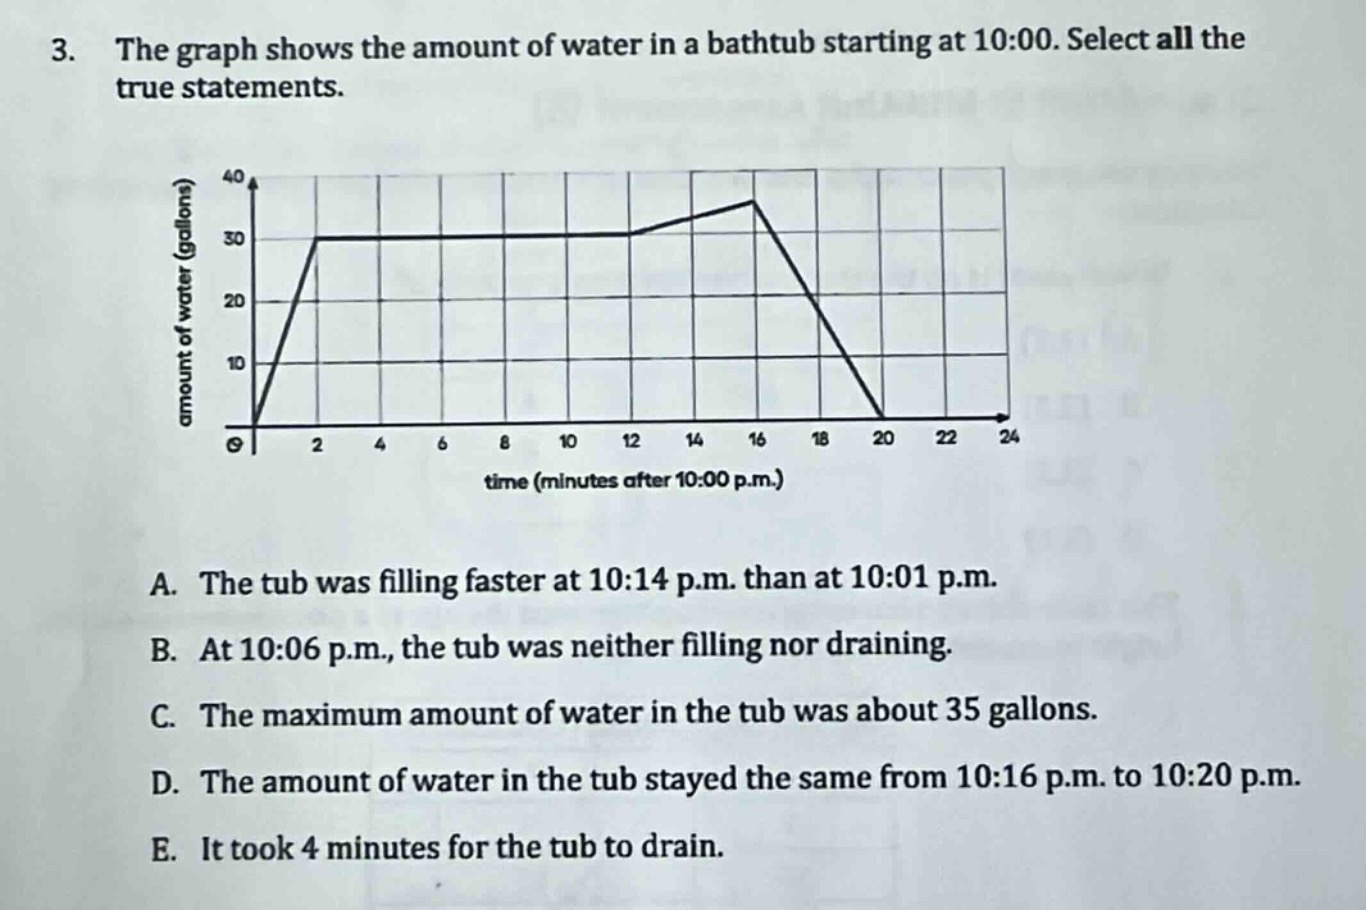
- the graph shows the amount of water in a bathtub starting at 10:00. select all the true statements.
a. the tub was filling faster at 10:14 p.m. than at 10:01 p.m.
b. at 10:06 p.m., the tub was neither filling nor draining.
c. the maximum amount of water in the tub was about 35 gallons.
d. the amount of water in the tub stayed the same from 10:16 p.m. to 10:20 p.m.
e. it took 4 minutes for the tub to drain.
Brief Explanations
- Option A: At 10:01 (1 minute after 10:00), the slope (rate of filling) is $\frac{30 - 0}{2 - 0}=15$ gallons per minute. At 10:14 (14 minutes after 10:00), the slope from 12 - 16 minutes: from 12 to 16 minutes, the change in water is $36 - 30 = 6$ over 4 minutes, so slope is $\frac{6}{4}=1.5$ gallons per minute. So 10:01 has a steeper slope (faster filling), so A is false.
- Option B: At 10:06 (6 minutes after 10:00), the graph is horizontal (slope = 0), meaning the amount of water is constant (neither filling nor draining). So B is true.
- Option C: The peak of the graph is at 16 minutes, and the y - value is about 36 (close to 35), so the maximum amount is about 35 gallons. So C is true.
- Option D: From 10:16 (16 minutes) to 10:20 (20 minutes), the graph is a line with negative slope (draining), so the amount of water is decreasing. So D is false.
- Option E: Draining starts at 16 minutes and ends at 20 minutes. The time taken is $20 - 16 = 4$ minutes. So E is true.

Snap & solve any problem in the app
Get step-by-step solutions on Sovi AI
Photo-based solutions with guided steps
Explore more problems and detailed explanations
B. At 10:06 p.m., the tub was neither filling nor draining, C. The maximum amount of water in the tub was about 35 gallons, E. It took 4 minutes for the tub to drain