QUESTION IMAGE
Question
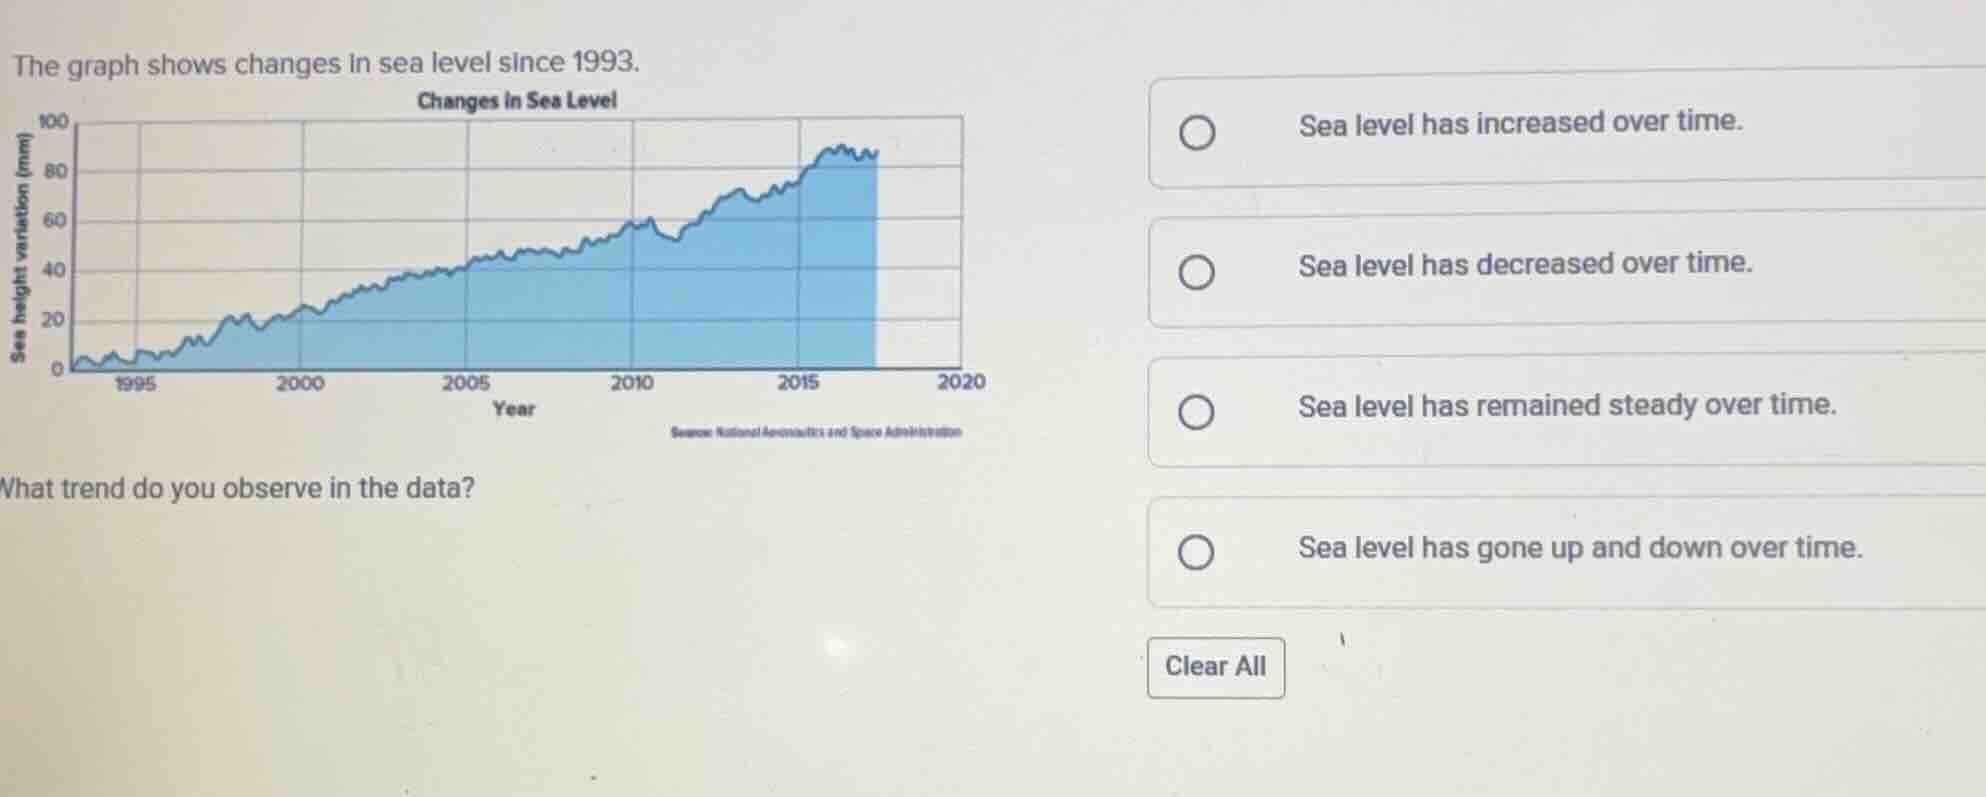
the graph shows changes in sea level since 1993.
changes in sea level
source: national aeronautics and space administration
what trend do you observe in the data?
sea level has increased over time.
sea level has decreased over time.
sea level has remained steady over time.
sea level has gone up and down over time.
clear all
Brief Explanations
The line graph tracks sea level variation from ~1993 to 2020. While there are small, short-term fluctuations, the overall direction of the line is consistently upward, showing a long-term increase in sea level.

Snap & solve any problem in the app
Get step-by-step solutions on Sovi AI
Photo-based solutions with guided steps
Explore more problems and detailed explanations
A. Sea level has increased over time.